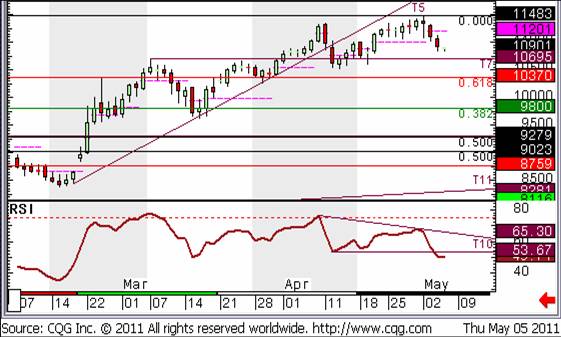
Things are getting interesting in the Oil markets, with signs of the market topping out. Our thoughts on the Brent contract are reproduced in this week’s Investors Chronicle, but there is something worth noting in the WTI as well, as per below, our commentary from this morning:
J Welles Wilder, one of the brightest minds in TA in my lifetime, and the guy who came up with indicators such as RSI, DMI and Parabolic SAR, suggests in his book “New Concepts in Technical Trading Systems” (published in 1978, so not that “new”!) that you can get a definitive signal when Divergences occur, by following his “Failure Swing” methodology. RSI topped out (with a reading of 76) on April 8th, when the price chart topped out at 113.46. We have since made a new high for price with a 114.83 print on May 2nd.
RSI topped out at 67.70 on that day (a lower high on the Indicator, a higher high on the price chart, or a “Bearish Divergence” as technicians call it). The low (on the RSI reading) between these two highs was 53, on April 12th. We broke below here yesterday, which gives a “Top Failure Swing” sell signal. These signals are usually pretty timely and robust.
We also broke support at 109.95 yesterday, which moved us “into the red” as far as our SkewBar is concerned.
Please go to http://www.futurestechs.co.uk/professional_trial/ to request a free trial of our service to see if it can aid your trading decisions.

