
I was recently asked on Social Media (Linkedin is my favourite place of late) what my views on Brent Crude were. My rather curt answer was “My clients know my view”. Was this curt though? I run a Subscription Technical Analysis service, so arguably if I share my views on things on Social Media I’m shooting myself in the foot and doing my clients a disservice, no?
The other side to this coin is that Social Media can be a very good place to share insight that may encourage new clients. So maybe a balance needs striking…
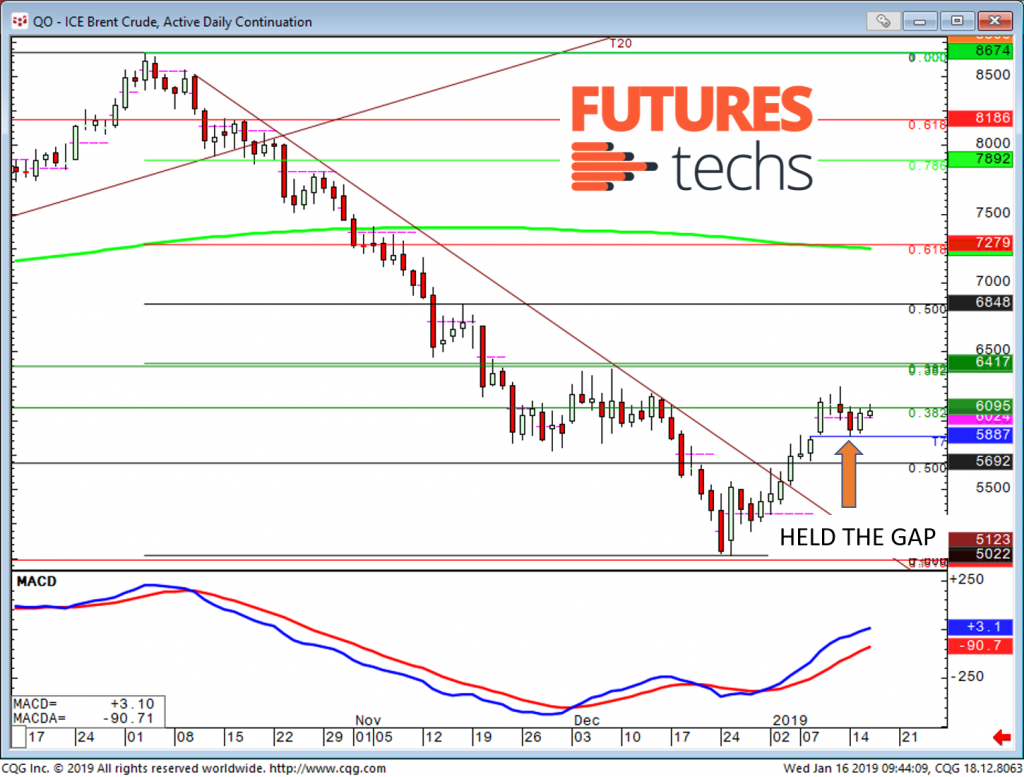
So what do the charts say about Brent Crude?! We have seen a decent recovery from the low that was put in over Christmas, and we started 2019 with a break of the downtrend line that had been defining the weakness though Q4 ’18. Last week (on January 9th) we gapped higher. The high on the 8th (58.87) immediately became a support level. And it’s worked out rather nicely, holding almost to the tick on the pullback we saw on Monday. “Stay with the bulls above 58.97 and buy a dip to here” was basically our message earlier in the week, so THAT’S what I think of Brent Crude!
I will be posting regular samples of our Analysis on here from now on so bookmark the page or keep an eye out on Linkedin and/or Twitter.
If you want a free trial please go to http://www.futurestechs.co.uk/premium_trial/ to set this up.
Happy New Year,
Clive.