
“Evening Star” at resistance to call a halt to the recent rally?
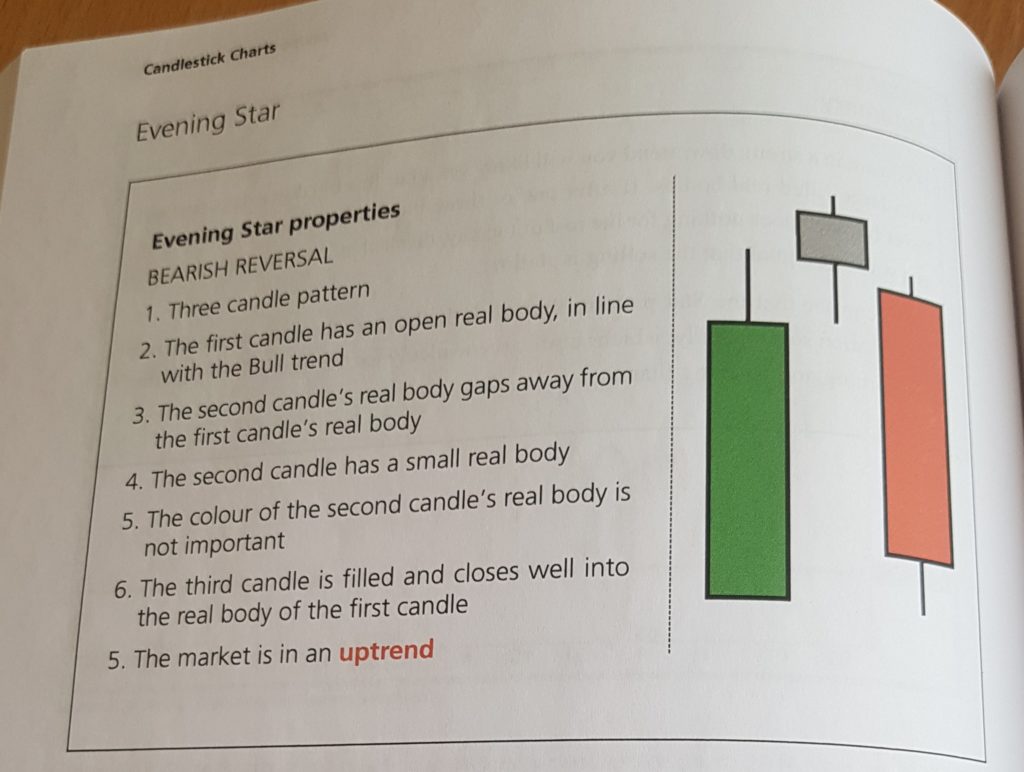
In candlestick analysis one of the more powerful reversal patterns is the “Evening Star”. According to my book the “rules” for an Evening Star are as follows:
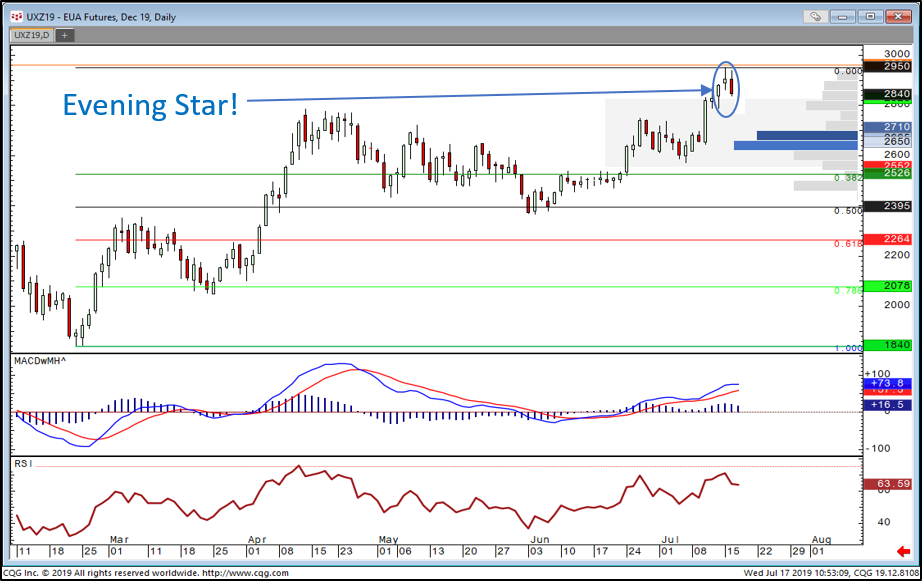
So what we’ve just seen on the daily chart for EUA Carbon Futures ticks all of those boxes.
But here’s something else. WHERE did we see this? What was the high of the pattern? It was 29.50. The high/failure back in July 2008 was 29.69… 19 cents away… Now I’ve heard hundreds of times that it’s “different this time” and it’s like comparing apples with pears and I’ve said each and every time that while that may be the case I’m just going to do my job and therefore I’m not going to ignore historic price action. Time will tell if this is a major top or just a signal for some profit taking and/or a correction.
For me right now though, it’s tough to ignore…
My clients knew about 29.69 (I’m sure everyone did to be fair, even those who were saying “it’s different..”), but they also knew going into yesterday what we would need to do to put this big reversal pattern on the chart.
If you think you could benefit from similar timely analysis then maybe you need to join the 40+ clients who now get our daily analysis covering EUAs as well as US, UK, and TTF Gas, Brent and WTI Crude, Coal and German Power.
Our clients (spreading from Slovenia to Dublin) range from small Suppliers to Hedge Funds to several of the big 6 Utilities as well as many of the world’s biggest Oil Companies.
Please go to http://www.futurestechs.co.uk/energy-markets/ to find out more and request a no obligation free trial.