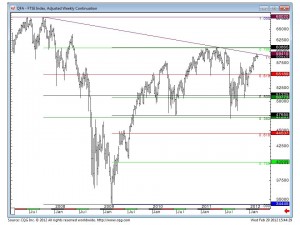
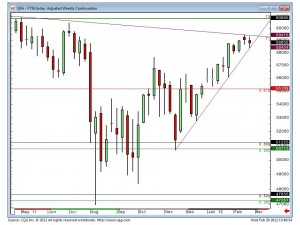
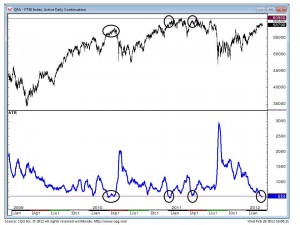
Three charts to show you today:
Here is a Weekly showing the gently sloping DOWNTREND LINE that can be placed above the lower highs since the failure/high in October 2007.
What this shows is that the recent rise has taken us up a key juncture. This has pretty much defined the recent highs TO THE TICK.
The next chart is the same as the first, a Weekly for the FTSE Futures, but this only shows the last 9-10 months of price action, and illustrates the rally from last year’s lows. As you can see there is an entirely different picture painted here, and another line, this one an UPTREND LINE, joining higher lows. This line is at 5840 this week and has already done a job, giving us the low/bounce on Monday.
However if we break the uptrend line, after failing at the downtrend line (hope you’re following this!!!) we get a powerful SELL signal.
The final chart backs up the idea that SOMETHING’S GONNA GIVE. It shows that every time we go below a reading of 50 for the ATR indicator the market is nearing or at a top. ATR stands for Average True Range and is a measure of the range on each session. A low reading means ranges are tigthening, and in recent years this usually preceeds/signals a top in the FTSE, as highlighted below.
We provide daily analysis on the FTSE as well as the DAX, Eurostoxx, Dow and S&P.
We also analyse Commodity and Bond Futures on a daily basis.
Feel free to ask for a free trial using the links above.


