
One of the things we at FuturesTechs towers take very seriously is Marabuzo lines.
What are they? A large bodied candlestick on a Daily chart is the result of a big one way push over the course of a day. In the example of large red real bodies the market often wakes up the next day sure in the knowledge that yesterday’s bout of selling should be good enough to guarantee further losses today. But sometimes things feel a bit overdone and there can be a reaction higher the next day. The big question then is whether this is a short term gains that deserves to be sold into, or if the market is going to continue to rally and take back the losses of the previous day?
The Marabuzo line is the halfway point of the real body (ie halfway between the open and close) of any large bodied candlestick, and we’ve found them to be excellent reference levels in the days after this “big event” Candles.
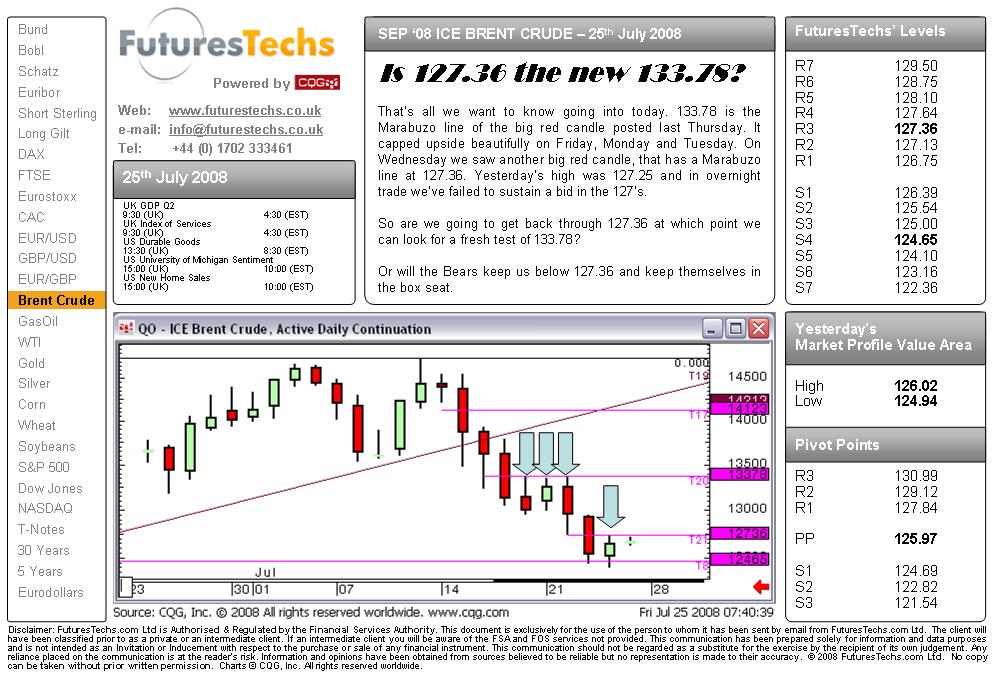
This week’s ICE Brent Crude Oil Chart is no exception. Last Thursday we saw a big down day.
The Marabuzo line of this session’s Candlestick was 133.78.
The high last Friday was 133.69
The high on Monday was 133.57
The high on Tuesday was 133.75.
Close enough?!
Tuesday turned out to be a pretty Bearish day, as was Wednesday. The Marabuzo line of Wednesday’s big red candle was 127.36, and Thursday’s high/failure was 127.25. Close enough?!
Which prompted our Brent Comment today, as per below. You can click on the image to see it in full size.
All very interesting, I’m sure you’ll agree.
Have a good weekend, and be sure to subscribe to our members area so you don’t miss out on these sort of calls. Click here.
Come on Essex in the Twenty20 tomorrow! And a Happy Birthday to my old mate Mickey. How old?! OUCH!!!