
I, like many technical analysts, place quite a heavy reliance on Fibonacci levels, especially for “bigger picture” calls and direction.
So what’s it all about? FuturesTechs members have a couple of articles I wrote a few years back that they can access in our Members’ area that explain things (I hope) quite well.
Take a look at the number sequence below:
1, 1, 2, 3, 5, 8, 13, 21, 34, 55, 89, 144.
The eagle eyed amongst you would have spotted how this sequence (called the Golden Sequence) comes about:
1+1 = 2
1+2 = 3
2+3 = 5
3+5 = 8
etc etc
Now divide the numbers in the sequence by the number preceding it. You will find that it comes out at a constant 1.618. This is known in mathematics as “Phi” (with a big “P”).
Now divide 1 by 1.618. What do you get ? 0.618.
Some pretty amazing symmetry, eh?! This number is called “phi” (with a small “p”).
Now look at your body. You have 5 fingers with 3 bendy bits on the end of your arms, that also have three bendy bits, that are stuck to your body that has 5 things sticking out of it (arms, legs and head just in case!!). All numbers in the Golden Sequence. There are plenty of occurrences in Nature as well (see the aforementioned articles in our Members area for more).
The most common usage of Fibonacci numbers in the financial markets is when things are retracing a big move, and this is what I thought I’d talk about today, because we’ve just busted through one such level in the Bund Futures.
You see between March 17th and June 19th this year (2008 in case you are reading this in years to come!) the Bund has sold off from 118.51 to 109.65 (using the adjusted continuation charts that we favour for Bond contracts). The market then started to rally, and once this got going we started to target 113.03, because at this level the market would have taken back 38.2% (100-61.8, in case you’re wondering!) of the weakness. This is the first big Fibonacci retracement line. On July 15th we got to a high of 112.88, so just 15 ticks away from our Fibonacci level, and the market promptly fell over. We posted a Shooting Star More on that day , a strong reversal pattern in Candlestick analysis (highlighted on the chart below, which you can click on to enlarge). We sold off after this and within a week or so we were back testing the lows from mid June.
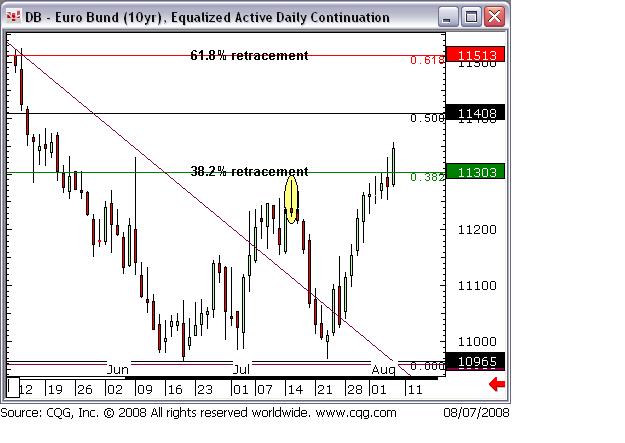
The rally that we’ve seen since July 23rd has seen us back testing this key 113.03 level once more, and today we’ve broken above here, on Trichet, and we’ve posted a strong reaction higher to boot.
The way we work here is to look for the 50% and 61.8% retracements as the next targets above once the 38.2% retrace is out of the way, so in the Bund our targets are now 114.08 then 115.13.
Finally I’ve been on the box again, so if you fancy listening to me blabbing on about Brent Crude and the Bund Futures then Click here.