
______________________________________
The first speaker on the Society of Technical Analysts (STA) annual diploma course, at least for the last few years, has been Julian McCree, who always extolls the idea of Market Sentiment, and in particular the Sentiment Cycle, a theory developed by Justin Mamis (author of The Nature of Risk, Stock Market Survival and The Meaning of life).
Someone once said to me, “The Market is a mechanism for messing as many people about as it can, as often as possible”. Sounds a bit cynical, but I believe a firm knowledge of the sentiment cycle and an understanding of where we are within the cycle could help us guard against being messed about and give us a clue as to where we’re heading (like a ‘roadmap’)
This prompted me to have a look at a historical chart for the FTSE, to try and glean where we’re at, and if this could give me an indication as to what the future has in store for UK stock markets.
Justin Mamis sums up nicely what the Sentiment Cycle represents “What we have is essentially a graphical representation of the manic depressive moods typically experienced by market participants as a function of time and price in one complete sentiment loop.”
See the chart below, taken from Mamis’ “The Nature of Risk” book.
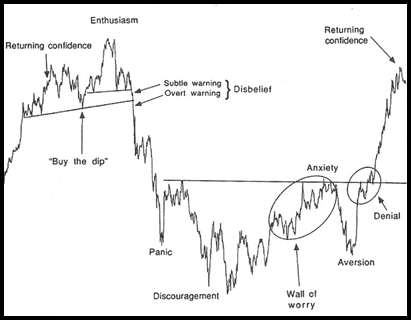
Before we go any further, let’s take a quick glance at the different phases and the market psychology behind them.
Returning Confidence
By the time confidence is fully restored the markets have been rallying for some time. They start to get choppy and retracement moves get consecutively more fierce, each one more intimidating than the last.
Buying the Dip (the big dip)
A huge pullback now gets underway, even larger than the scary one you may have witnessed last month or so. After such a dynamic bull run, investors are willing to take on a phenomenal amount of risk and the smart money buys the big dip. Also, money is still flooding in from the general public, who likely read in The Sun that stock markets will remain strong for all eternity.
Enthusiasm
At this stage all economic data still supports the idea of higher prices. Traders that didn’t get involved in the last dip-buying opportunity now have hard evidence that it worked before. All of the traders that wanted to be long, are long (there are no more buyers), causing prices to decelerate. Distribution starts to take place, i.e. stock transfers hands, from smart money to stupid money…. Strong to weak.
Disbelief
Traders start to get that gut wrenching feeling that something may be changing but the fundamentals still don’t back this up, and people cling onto hope alone. Analysts start to get subtle warnings. Maybe previous market leaders start to break below important support levels or Moving Averages.
Overt Warning/Panic
Typically there’d be a catalyst here (i.e. big banks like Lehman brothers start to file for bankruptcy… sound familiar?). The index will break below a previous reaction low or maybe the 200 day Moving Average. News readers will be telling the world that the fun is now over. Intelligent investors start to sell rallies, giving stock prices little/no chance of any recovery.
Discouragement and Aversion
Prices have been rattling off for some time now, as the general public start shedding stock and the short sellers are stronger than ever. There’s no good economic news flow and everyone thinks that stock markets will go down forever.
Wall of Worry
Certain market sectors will now start to bottom out as everyone that wanted to sell has done so. The smart money now starts to move in slowly, resulting in the market pausing for breath or drifting along sideways for a few months. There are no sellers left, so despite the bad news flow markets start to creep higher. Short sellers start to cover their positions, adding fuel to the fire.
Aversion to Denial
Markets start to trend upwards. Short sellers start to get concerned that sentiment has changed. With no sellers above the market, these sorts of moves can be fast and sharp and tend to leave people behind.
This brings us back to ‘Returning Confidence’.
So where are we now?
Below is a weekly chart of the FTSE Futures (Dec’08). I have labelled the chart accordingly with respect to the different phases.
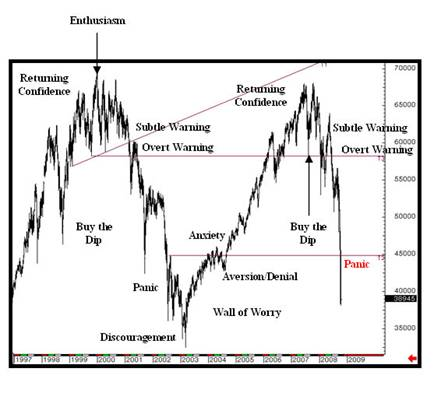
So the chart is suggesting that we’re in ‘panic mode’ just now approaching the “discouragement” phase.
What does this mean for the UK stock market?
Well, it means that the pain is not yet over, and that we’ll make another new low before a bottom is in place.
This would be followed by a sideways period and a slow grind higher, before we can start to truly think Bullish thoughts once again.
Let’s see how it all pans out. In the meantime one thing this does suggest to us is that there’s light at the end of the tunnel in the long-term, but in the short-term as we said all along, this is not the time to be picking a bottom.