
Fibonacci retracements have worked like a dream of late in the Dow, and they’re currently causing our recent bullishness a bit of trouble. Let’s first of all reproduce the commentary we’ve put out today for the Dow:
Now lets go through that and work out what Fibonacci has got to do with it. We have several articles on this blog and in our Website members area concerning Fibonacci so this time round I’ll just assume that you’re happy with the idea that when a market is in recovery mode it quite often recovers 38.2% or 61.8% of the previous move. The sell off from January 6th to March 6th took us from 9048 to 6460. The 38.2% retrace of this move is 7450. See how this featured as a target once we started rallying. 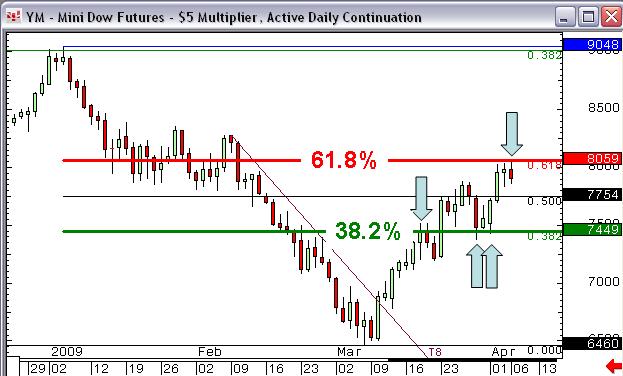
The 61.8% retrace of this same move is 8060. This, again referencing back to our commentary, was the next target once 7450 was seen off. We hit this level today. In fact it’s the high of the day. This is a slight worry. This may be just a temporary “blip”, and this is how we’ll treat it for now. But there is now a chance we can move back to 7450, and if this level were to break we’d have to forget being bullish and look for further weakness, back to 7071. We don’t expect any selling from here to get below 7450, let alone 7071 (for lots of other reasons besides the Fibonacci work). But If it did we’re totally wrong about the March low being THE low.
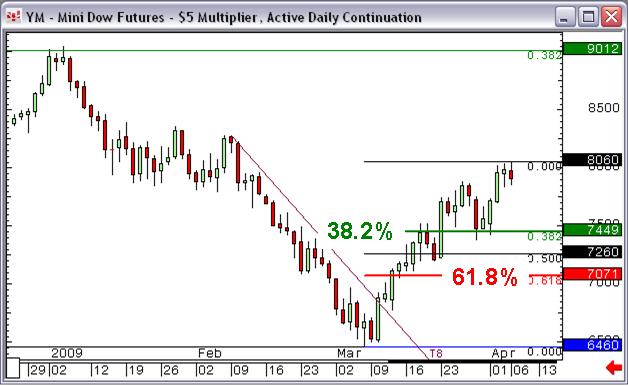 You can see the symmetry of these numbers in harmony from the charts we’ve posted. Because today’s high is BANG ON the 61.8% retracement of the Jan-Mar sell-off, the 38.2% retrace of the recovery is EXACTLY THE SAME as the old 38.2% retrace (of the Jan-March selling): 7449. One last interesting thing that will shape the bigger picture outlook: The 38.2% retrace of the selling seen between May 2008 and March 9th is up at 9012. And what is the year’s high from January, the start of the last big down-leg? 9048… Making for a pretty important area of resistance, wouldn’t you say? Have a good week.