
We included the RSI and Parabolic SAR indicators in the new levels sheet available in our Members Area, so thought that it would be worthwhile to briefly introduce them to anyone who might not be familiar with how they worked or how to use them.
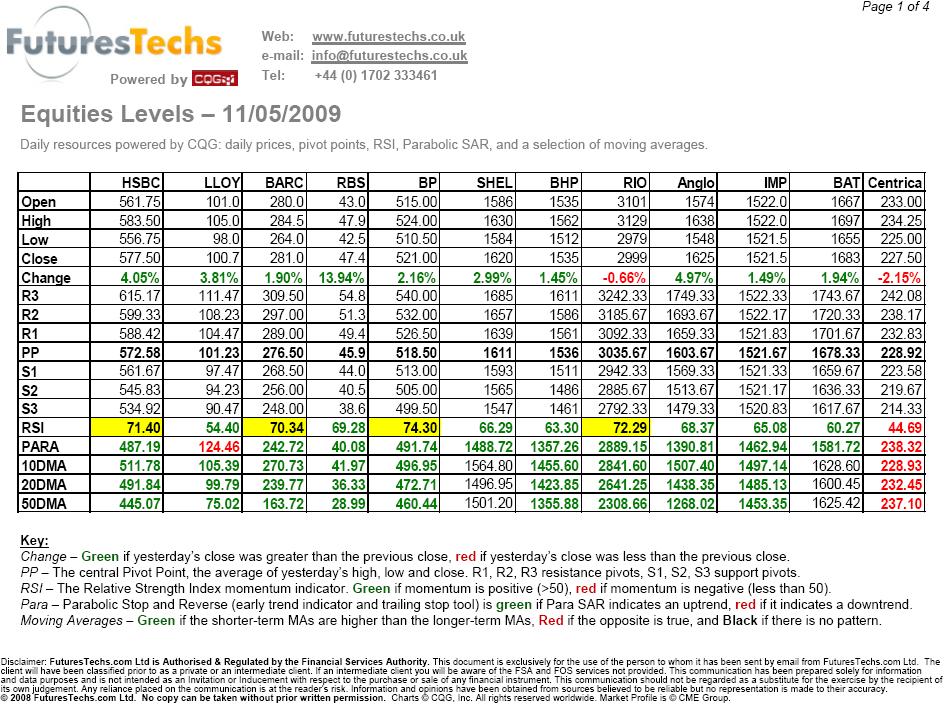
Fig 1: The New Levels Sheet. (Click to enlarge)
RSI (Relative Strength Index)
One of the most popular oscillators, the Relative Strength Index was first introduced by J. Welles Wilder in his popular, now-classic book, “New Concepts in Technical Trading Systems” (Trend Research, 1978).
The calculation might not look intuitive, but it really isn’t too complicated:
where RS is the “Relative Strength” of up days versus down days over the period being used (typically fourteen).
As originally calculated by Welles Wilder, the strength of up days is calculated as follows: for each day, “Up” is recorded as: the difference between the close and the prior close if there was on increase, or as zero if there wasn’t. “Down” is recorded similarly: the size of the difference between the close and prior close (always a positive number) if it decreased, or zero if it didn’t. The exponential moving averages of “Up” and “Down” are calculated, with the EMA of “Up” then divided by EMA of “Down” to give us the Relative Strength.
RSI is bounded in the range 0-100, and the use of the exponential moving averages makes it reasonably smooth, solving two issues which often arise with oscillators (for example: the simple Momentum indicator – the difference between latest close price and the price n periods ago – is neither smooth nor bounded, making for volatile swings which can’t be compared across markets).
The key takeaways from RSI are:
The ideas that hold true for oscillators in general hold true with the RSI. The oscillator will frequently turn around before the price does – for example, a price still rising that is accompanied by a falling RSI produces a bearish divergence between price and oscillator, a major warning that the up trend is running out of steam (see Fig 2 below).
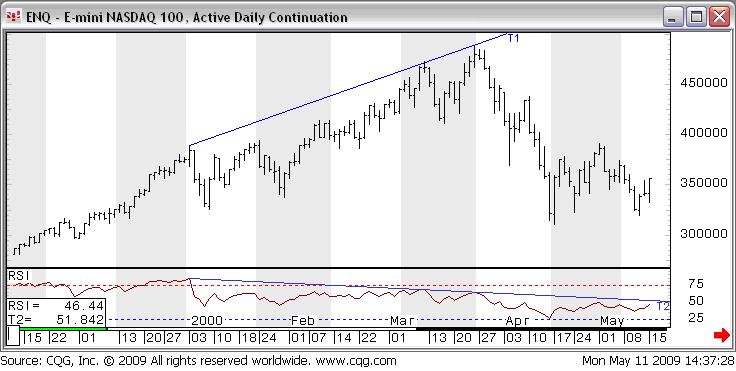
Fig 2: NASDAQ Futures, September 1999 – May 2000. Divergence between price and RSI at the height of the bubble. (Click to enlarge)
It’s worth reinforcing that extreme RSI readings do not by themselves constitute buy or sell signals. For example, the most that a high RSI, even one above 70, can indicate is that if the market is ranging, it is now due for a correction. The sell signal won’t actually be produced until RSI starts declining back toward neutral levels, and if the market is trending instead of ranging, then it could stay at elevated levels for extended periods of time. As with any indicator, trader discretion is advised.
When looking at our levels sheets, simply checking whether the RSI is above or below 50 tells you something about the internal strength of that market. Additionally, we highlight the figure in yellow if it is in one of the extreme overbought/ oversold zones. A cluster of extreme overbought/oversold markets in the same sector of our equities, commodities or Forex sheets provides interesting information about general market trends, while also helping us to identify specific opportunities.
Parabolic SAR
Another invention by Welles Wilder, the Parabolic Stop-and-Reverse is designed as a trailing stop system with a difference. Originally called the Parabolic Time/Price System, the stop is calculated as function of price and time.
The SAR alternates between providing stops for shorts and longs, switching as soon as a stop is activated. In the chart above, the blue marks are the stops for shorts, with the red marks the stops for longs. As you can see, this system is “always in”, meaning that it always indicates an uptrend or a downtrend (depending on which type of stop was the last one to be activated), so that somebody who focused exclusively on it would always have a position in the market. This makes it unsuitable for ranging markets, where a trader using it would be constantly whipsawed (see Fig 3 below).
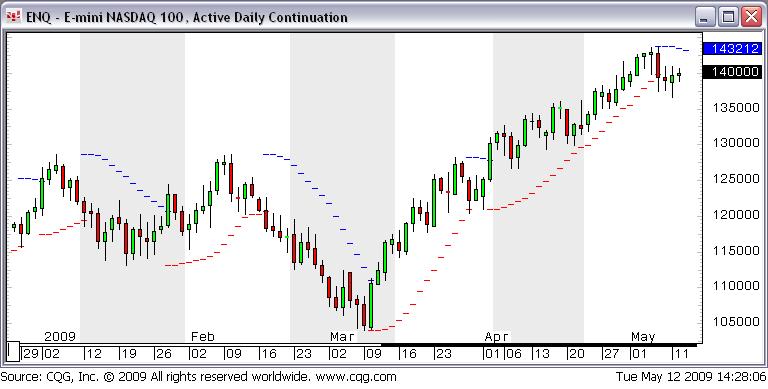
Figure 3: NASDAQ Futures, January – May 2009. Whipsawed until mid-February, and then helpfully following the trends. (Click to enlarge)
The stop is calculated by:
Today’s SAR = (Yesterday’s SAR) + (Acceleration Factor)*(Yesterday’s Extreme Price – Yesterday’s SAR),
where yesterday’s extreme price is the high in a downtrend, or the low in an uptrend, and the Acceleration Factor is a fraction which increases incrementally each day up to a maximum value, providing the distinctive parabolic shape (this is the part of the formula incorporating time).
The recommended use of the Parabolic SAR is as a stop in a trending market where other, primary tools of analysis have originally motivated the trade. The stops which it provides won’t rush to the price action too quickly at the start of a serious move, thus giving it some initial time in which to develop. However, the increasing “Acceleration Factor” means that it will pick up speed when it isn’t activated, until it races quickly towards the price. This means that when the trend does eventually lose momentum, it will quickly catch up with the price and close out the trade.
Our levels sheets provide the SAR stop in green if it’s the stop in an uptrend, or in red if it’s the stop in a downtrend. Again, simply browsing which sectors are predominantly in uptrends or downtrends according to the SAR provides useful information, even if you aren’t using the stops in trading a specific market.
A Note on Parameters
Note that as with all indicators, the parameters of the RSI and the Parabolic SAR can be tailored to suit the individual markets under consideration. Our levels sheets use the most commonly used parameters for each indicator (14 periods for the RSI, an acceleration factor of .02*(t) up to a maximum of .2 for the Para SAR), for the same reason that we look at 10, 20 and 50-day moving averages: besides being reasonable parameters to use most of the time in their own right, they are the parameters that a majority of people automatically use anyway, and therefore gain technical significance purely on that basis.
Other Indicators, Other Markets?
The levels sheets are there to assist our members and if there are particular indicators and/or markets which you would like to receive automated levels for, please let us know and we’ll do our best to include them. While automated indicators and levels are never going to be a trader’s panacea, when incorporated into an overall strategy they are a key ingredient of successful trading.
Graham Neary (graham@futurestechs.co.uk)