From today we plan to post one of our Technical Analysis Reports on this Blog on a daily basis as a sample for anyone interested in a Free Trial. We will focus on a market that is showing something interesting from a technical point of view.
We cover 22 markets every day, giving Chart, Support and Resistance levels, plus Commentary each morning before the markets open. This award winning service is widely read by Investment Professionals, and some of our clients have been with us since we started over 10 years ago.
If you are an Individual Trader please go to http://www.futurestechs.co.uk/trial/ to request a free trial of our Web-based service.
The same reports are available to Fund Managers, Brokers and “Pro” Traders in printable format. If you are in this category please request a trial at http://www.futurestechs.co.uk/professional_trial/
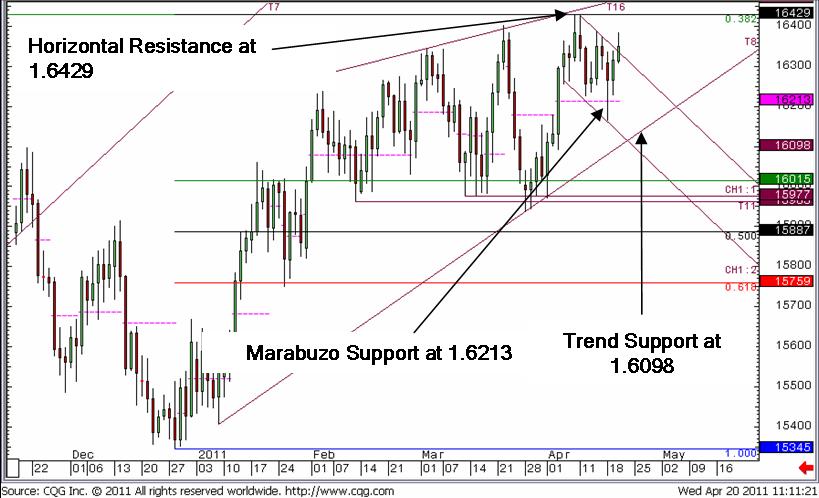
In today’s “Forex Lunch” report we highlighted a Flag Pattern in Cable (GBPUSD):
Cable has been in a consolidation pattern since late January, trading in a broadening range between 1.5937 and 1.6429. Recent price action within this range has formed a pattern known as a flag, consisting of a short term counter trend channel after a significant directional move. The counter-trend channel is highlighted by the red arrows, whilst the flag ‘pole’ is highlighted by the green arrow. This formation would be confirmed by a close above the down trend channel at 1.6336, with additional confirmation given by a close above Horizontal resistance at 1.6429. The implication of this formation is a move to 1.6828.


