
We often get asked “How can I use your product?”
FuturesTechs provides support and resistance levels to professional traders across a range of different Futures markets. They use our levels as the basis of their day trading.
Unfortunately I often come across traders using them in different ways, so it’s tough to give a definitive answer to that question. We are all different, and do things in different ways, and the individual’s interpretation of the levels we produce is no exception.
Let me make something clear right now. A lot of what we do here at FuturesTechs is basic common sense. We are almost “reporting” the technical news.
Take today’s FTSE Futures price action as an example. In our report this morning we talked about how important resistance at 4220 was, and we made this a bold level to make sure our readers got the message!
It was a VERY obvious level, being Friday’s high: Quite simple, unless you decided to ignore the simple and obvious.
It gave us the high this morning, not once but twice.
The low between these two highs was 4174, so we got a sell signal (Double Top) on the short term (eg 10 minute) charts once this gave way. We had 4163 posted as our first support, so on the way back down (if you hadn’t sold at the bold resistance at 4220) there were two more opportunities to sell; once we broke 4174, or even safer once we sold off through 4163.
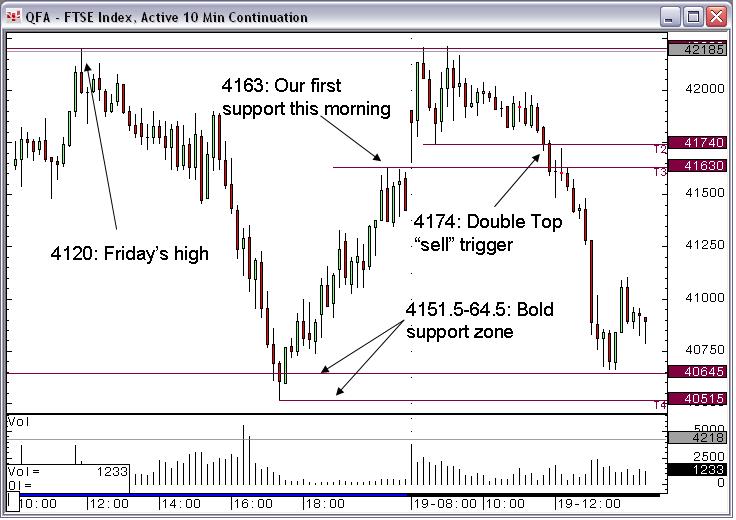
Where to get out? We had a bold “area” of support at S5 in today’s report, between 4051.5 and 4064.5. The lunchtime low was 4066.5, where we suddenly started posting reversal candlestick on our trusty 10 minute chart – time to cash in.
Hopefully this gives some insight into how one can use technical levels to help decide where you put on trades, and where you get out.
Ideally you should aim to create trades with a basic set of criteria.
- Trade in the direction of the overall trend.
In other words In a downtrend sell ahead of an important resistance with a tight stop if it breaks.
Buy ahead of a key support level in a rising market.
- Targets should be acheivable, especially considering the current market conditions. It is Martin Luther King Day in the US today, so large swings of volatility are unlikely.
- Targets should also not be “blocked” by large resistance or support levels. For example if you decide to buy a Stock at £1.03 with a stop at 99p then you want to have a target of at least £1.11, to give a 2:1 reward to risk ratio: You are planning to make twice as much as you’re willing to lose – the way it should always be.
But if £1.10 is an old high on several occasions it is hopeful at best to ask the market to trade £1.11, so you have set a target that’s going to be tough to achieve.
Whenever you’re looking for trades to put on you want to try and skew things so that it’s going to be tough to get stopped out, but much easier to head to your target.
This doesn’t mean you’re not ever going to get stopped out, it just means you’re stacking the odds in your favour. This is what Technical Analysis does, and what we hope to help YOU to do when you use our service for YOUR trading decisions.
And one last thing while we’re talking about stops. RESPECT YOUR STOP. It is very easy to move a stop further away if a market’s getting near to triggering your loss. If you have set a stop, then LEAVE IT WHERE IT IS!
So far 2009 has been a tough year to call. Volatility has dropped, but we haven’t gained any firm directional traction yet in most anything. Although it goes against our usual mode of operation to give longer term calls we are still happy with our overall view for Equity markets for 2009; that we will make a new low in the early part of this year, but end the year quite a bit higher than where we are now…