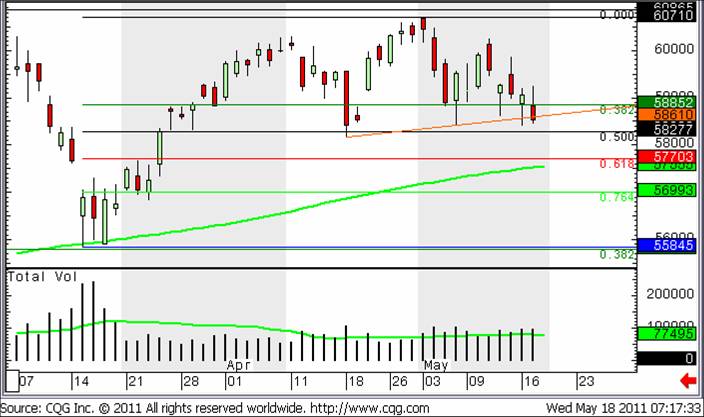
Last week we posted a Blog about the potential Head and Shoulders pattern forming in the FTSE Futures. Things got interesting with respect to this yesterday, which was the crux of our morning report, reproduced below.
The fact that we’re not breaking this line PROPERLY does suggest the market’s ambilvalence is set to continue.
Towards the European close yesterday we were selling off, and we’d got through 5858, the Neckline of the Head and Shoulders pattern that we’ve been watching of late. So on the “Day only” chart that we prefer, as above, we have a slight closing break of this Neckline, and a sell signal.
Except we’re called 50 higher this morning and this will instantly tell us that the sell signal is a false one.
It looks like the market is happy in it’s current moribund range-bound confused stupor, and we’ve got to put up with this situation for a bit longer.
We’re not getting any firm signals at the moment, then, and this counts for the Individual stocks as well, making our (and your) job a rather tough one.
Trial for Professional Traders/Brokers and Fund Managers, click here.
Trial for Individual Traders/Spread Bet/CFDs traders, click here.

