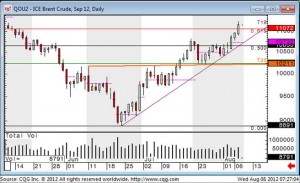
On July 17th Brent gave a buy signal from a “Head and Shoulders bottom” pattern. On that day we finished our commentary thus: 116.65 here we come!!!
Since then we’ve seen a rally to 108.18 then a pullback that held the broken Neckline, followed by another strong rally. Here are a few snippets from our analysis this week:
Monday:
The market has been stuck in a sideways range for 2-3 weeks now, ever since we got the Head and Shoulders buy signal in fact! This isn’t unusual for Brent unfortunately, but the Neckline is holding, and this encourages us to think that resolution of said range will come to the upside, ie a move through 108.18, so we will continue to back this idea.
Today:
The bulls are doing very well right now and continue to boss things, having taken out 110.00 and 110.72 yesterday on the way to a high of 112.56.
We are now at levels not seen since May and the next really decent resistance level is 116.65, the “measured move” target of the Head and Shoulders bottom pattern that has been the central core of our recent (bullish) analysis/skew. It’s also the 78.6% retrace of the sell off seen between March 23rd and June 22nd.
Onwards and upwards!!
FuturesTechs produces daily Technical Reports for Brent Crude Futures as well as NYMEX WTI, GasOil, Natural Gas and Carbon Emissions (ECX EUA). For 12 years we have been a market leader in provision of analysis to traders across a number of asset classes.
We also write daily analysis on Equity and Bond Futures, and Forex majors.
Please use the buttons above to request a free trial.

