
Back in December (the 8th to be precise) I “broke my silence” on BitCoin with a Blog post. I compared it to Silver in the 1980s and Tulips in the 1630s! It turned out to be one of the most popular posts I’ve ever done. That proved one thing to me: That there is a lot of interest in “Crypto”.
The question is “Why?” Is it because this is the future? A brave new world? Or is it because people are waiting for the bubble to burst? It could be a bit of both. All I do know is it would be rather remiss of me to just leave it at that. So below is a bunch of charts for 4 of the leading “Coins” in the Crypto space at present:
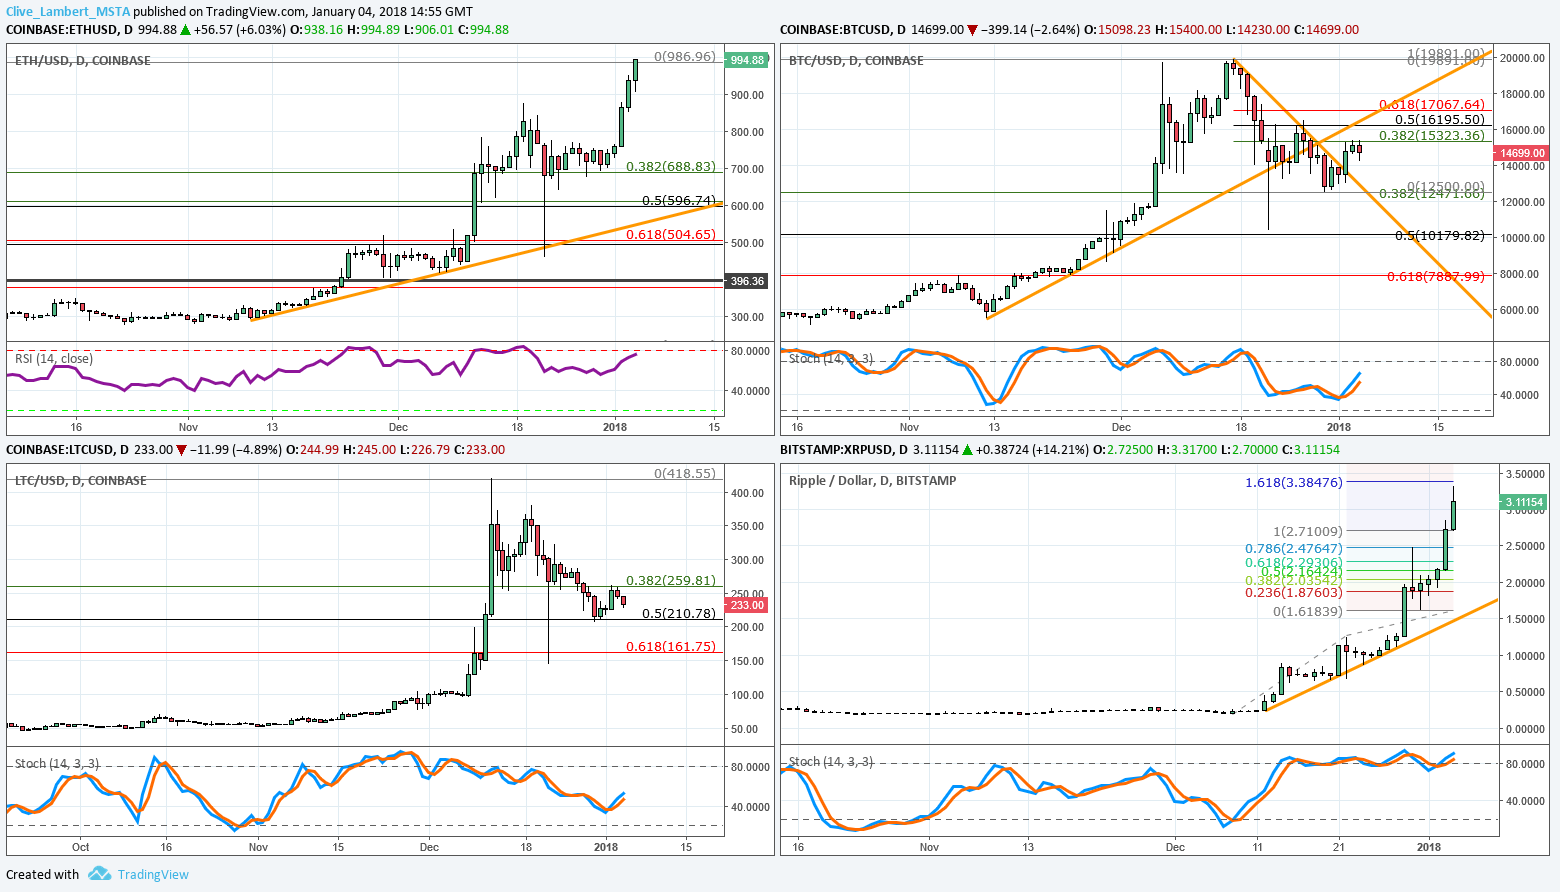
What do these charts tell us? I will outline some brief thoughts on each individually below, but one thing I would point out as a general observation is that our old friend Mr Fibonacci seems to be having a say, which is obviously more than interesting to a chart nerd like me!
Top Left: Ethereum (ETH/USD): 400 was a big level, but this is ancient history now as we’ve just printed 994, with gains seen from 741 already this week. This is starting to look a little “frothy”, as BitCoin and LiteCoin were back in December.
Supports: 875, 760, 688, 606, 541.
Resistances: 1000, 1131, 1199, 1409
KEY LEVEL(S): 875 and 1000.
Top right: BitCoin (BTC/USD): This spiked up to above $19,000 in December and has since, according to some exchanges, printed $10,400. Quite volatile, then! In recent weeks while some of the other Coins have been heading higher at a pace this has been “damp”, almost suggesting to me that there is some sort of “rotation” thing happening already in the Crypto-space. Chart-wise 15325-400 is a big area of resistance that is currently weighing. A break of 12470-12500 would target 10180 then 7900.
Supports: 14130, 12500, 10180, 7900
Resistances: 15325-400, 16490, 17070, 19891
KEY LEVEL(S): 15400. Further weakness expected all the time this is above.
Bottom Left: Litecoin (LTC/USD): A bit like BitCoin this one is well and truly “off the boil” after December’s excesses and seems to be losing out to Ethereum and Ripple. 259-60 is capping things for now and all the time this is above we can look for a fresh test of 210 then 161. So retaking 260 is the bulls’ priority.
Supports: 206-10, 199, 161, 144.
Resistances: 260, 287, 321, 380.
KEY LEVEL(S): 260. We expect to see further weakness unless this levle is retaken.
Bottom right: Ripple (XRPUSD): This has been the stellar performer since mid-December, trading from 0.24 to 3.17 in that time. Wow! But as I said in my last Blog when things “go parabolic” it’s generally time to bail. This feels like that now. Also I have a Fibonacci target of 3.38… A return to something resembling “normal” (whatever that is!) could see this back to 1.50, where our orange trendline sits. Watch for candles with long upper shadows* as these are a sign of upside rejection.
Supports: 2.70, 2.47, 2.12, 1.75
Resistances: 3.32, 3.38, 3.91, 4.50.
KEY LEVEL(S): 3.38 above, 1.50 below.
I’m still undecided whether to add “Coins” to my suite of daily reports. In the meantime please have a look around the site and feel free to register for a FREE TRIAL of our daily service:
*If you want to read up on candlesticks here’s a book (my book!) that you might find useful!