
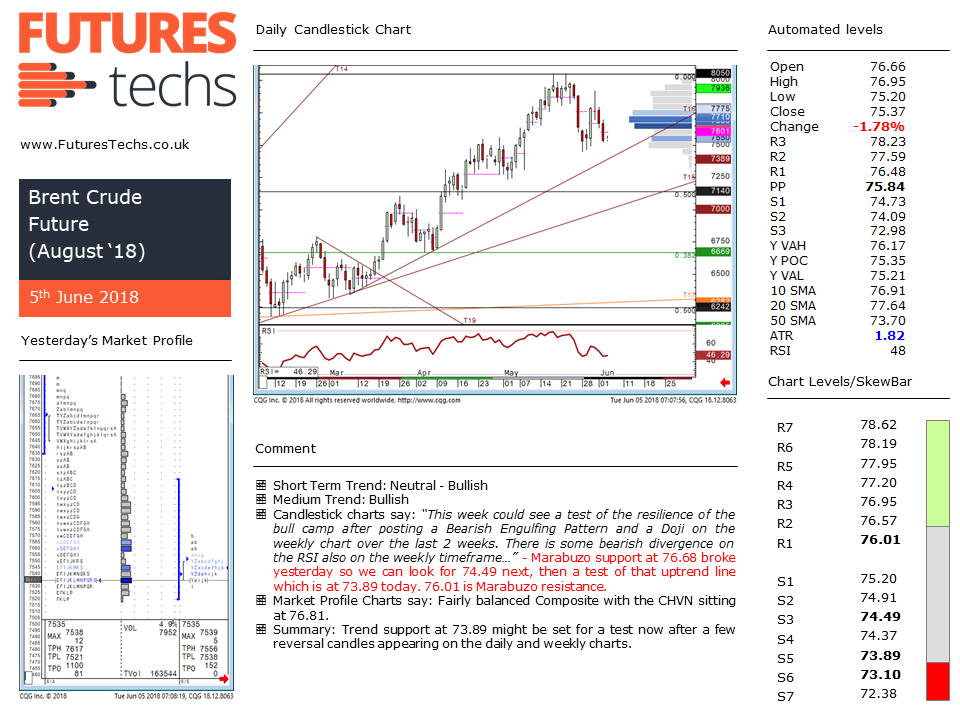
Below is the report we sent to clients on Tuesday (June 5th). Brent Crude has been retracing of late after getting a nose bleed above $80 in mid-May. We have been expecting the buyers to step back in and have been keeping an eye on a few important support levels on the pullback to see if this is happening. and on Tuesday it happened… at an uptrend line. You can see that on Tuesday morning we had cited 73.89 as a key support level (hence the bold type). The low was 73.81 and since then we’ve seen a solid recovery. This is an example of how our reports can add value.
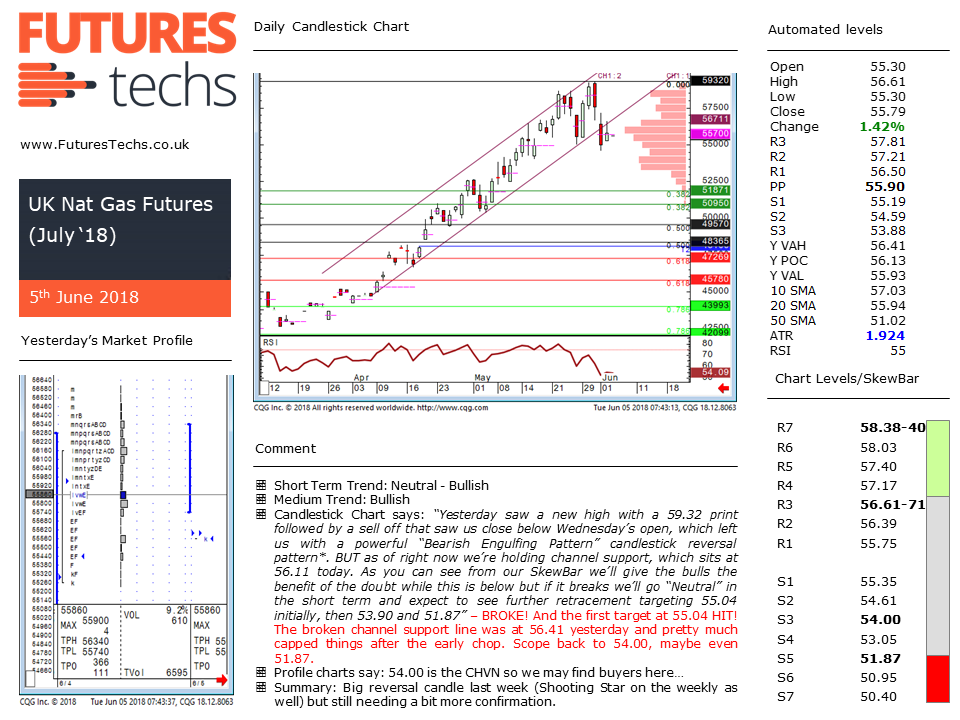
UK Natural Gas has also pulled back and we flagged this pretty early as we noted a reversal candle (A powerful “Bearish Engulfing Pattern More”) at the end of May. Again on Tuesday we cited the broken channel support line as one to watch on any recovery trade. This was at 56.71. The high that day was 56.80 and from here we saw selling down to 53.69.
If you would like to have a free trial of our reports please click here.
As well as Brent and UK Nat Gas we also cover the NYMEX WTI, Henry Hub Gas, Dutch TTF Nat Gas, EUA Carbon Emissions and German Baseload Power on our Energy report.
Other asset classes are also covered: Bonds, Equity Futures and Forex.
Our analysis utilises volume at price data as well as the traditional candlesticks methodology to gain additional insight to where the market’s perception of value is, and if we are moving away from it. This extra dimension provides valuable information not available on your standard charts.