
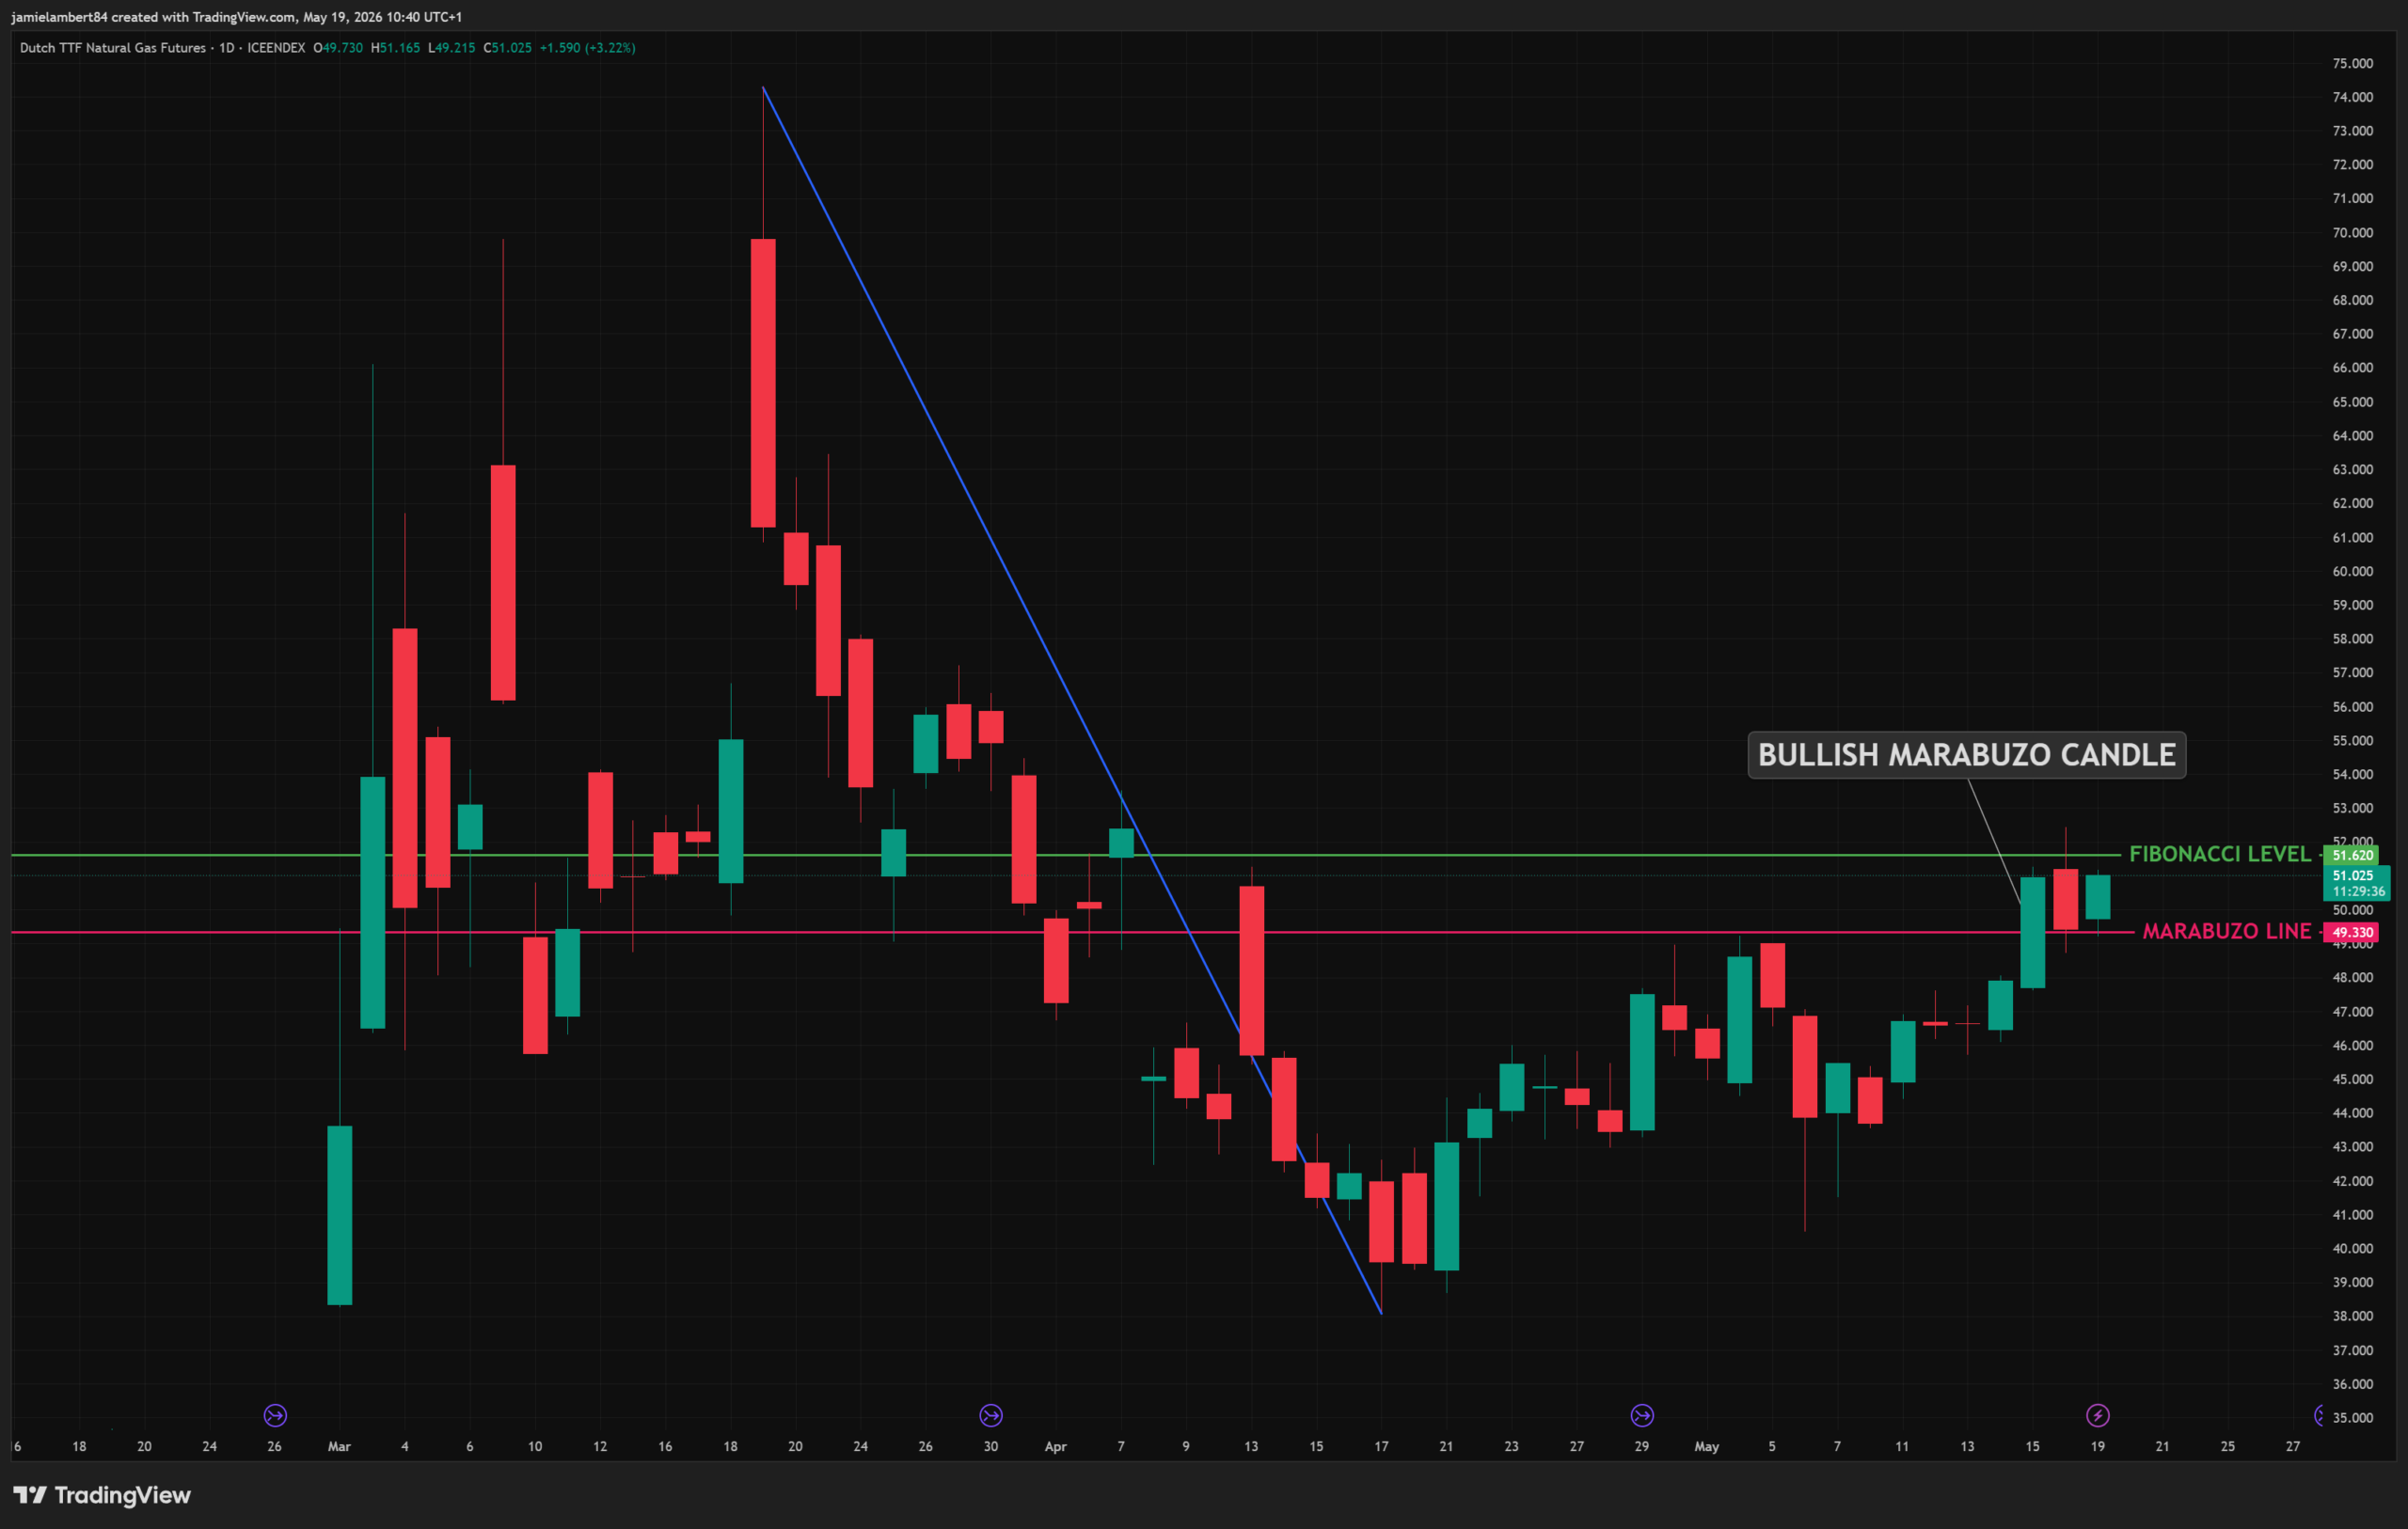
Following Friday’s breakout session, Dutch TTF has established a critical new structural support level at 49.33, representing the 50% midpoint of Friday’s Bullish Marabuzo More candle; known as the Marabuzo Line. With the market opening the week above this zone at around 51.20, the short-term technical bias is Neutral to Bullish. On Monday we saw a red candle that broke through all support levels but recovered towards the end of the session to close back above 49.33. Another key level we are watching is the 51.62 Fibonacci level, which represents the major 38.2% retracement of the entire sell-off from March 19th to April 17th.
Marabuzo Lines in Candlestick Analysis
In plain English, a Bullish Marabuzo More is a long, solid green candle with almost no shadows/wicks at the top or bottom, showing that the Bulls took charge from open to close. How this shapes our analysis, is the introduction of a brand new structural level and a possible change in psychology of the market.
Once we see a Marabuzo candle on the daily chart, the level we reference from is a 50% retracement from the open to close of the candle.
From there, it becomes a waiting game to see if the following sessions break back down through that mark or hold above it as a newly formed support floor. Once we get that confirmation, we can infer whether the market has truly shifted its underlying sentiment.
In this case, if the price stays above that Marabuzo line at 49.33, it serves as a strong signal for the Bulls to get busy and drive the breakout higher. On the other hand, if it breaks back through, it suggests the recent gains may be a little overcooked, giving the Sellers an opportunity to consolidate and push the market back into its old range.
Monday’s Price Action & The Current Outlook
Monday’s trading session provided a textbook test of this exact psychology. We saw some selling pressure where the price actually broke back down under our 49.33 Marabuzo line.
However, the Bulls stepped right back in and recovered the level before the end of the TTF liquidity window. Seeing buyers defend that 50% midpoint on the very first test alters our immediate technical analysis to a more Neutral to Bullish outlook in the short term.
As we watch the screens on Tuesday morning, TTF is bid back above the €50.00 mark. The big question now: Can the Bulls maintain this upward momentum?
Our reports offer industry-standard commentary on all moves like these across a range of markets in the Energy sector. Before the European Open, in your inbox.
If you would like a free trial of the Futurestechs reports. Get in touch today.

Clive Lambert FSTA – FuturesTechs
25 years of institutional expertise in the UK and European Energy Markets and 10-time Technical Analysis award winner. Clive provides industry-standard technical outlook, utilising Market Profile and Candlesticks Analysis for over 100 global trading desks.
Disclaimer:
This communication has been prepared solely for information and data purposes and is not intended as an Invitation or Inducement with respect to the purchase or sale of any financial instrument. This communication should not be regarded as a substitute for the exercise by the recipient of its own judgement. Any reliance placed on the communication is at the reader’s risk. Information and opinions have been obtained from sources believed to be reliable but no representation is made to their accuracy.