
EUA Carbon has just hit a resistance level at 74.74-84 that we’ve been talking about for a good while now. In fact the first time we mentioned this to clients was in a note dated March 18th, even before it bottomed out. Here is what we said then:
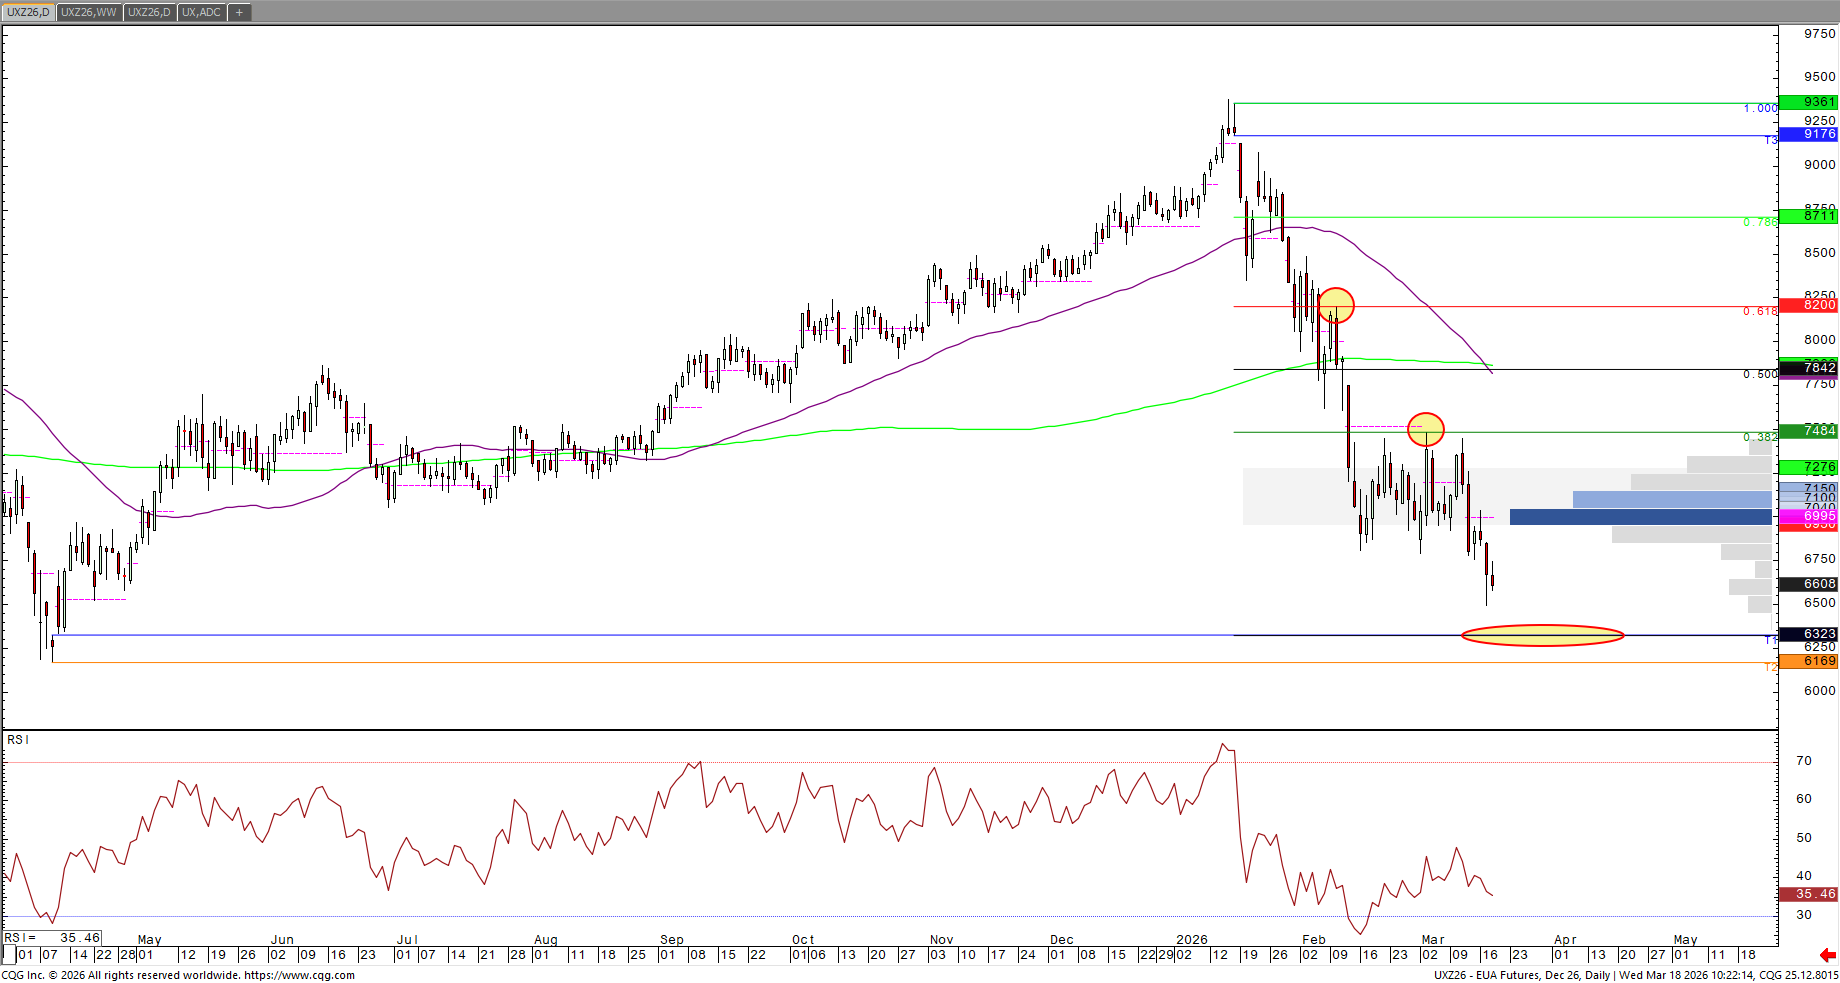
“If you wanted a near perfect downside target/area of support to gun for right now it is 63.26-30. Look at the chart below.
As well as being a gap from last April there is also something interesting going on here from a Fibonacci point of view.
With a low around this area we would have the 38.2% (of the selling since Jan 16th) at 74.84, bang on the March 3rd high/failure, and the 61.8% mark would be bang on the 10th February high/failure at 82.00…
Things that make you go “Hmmmm…”
To stay updated on these key technical shifts across the Energy markets (and many more), start a free trial today – no obligation. We hope it can add value to your trading decisions.

Clive Lambert FSTA – FuturesTechs
25 years of institutional expertise in the UK and European Energy Markets and 10-time Technical Analysis award winner. Clive provides industry-standard technical outlook, utilising Market Profile and Candlesticks Analysis for over 100 global trading desks.
Disclaimer:
This communication has been prepared solely for information and data purposes and is not intended as an Invitation or Inducement with respect to the purchase or sale of any financial instrument. This communication should not be regarded as a substitute for the exercise by the recipient of its own judgement. Any reliance placed on the communication is at the reader’s risk. Information and opinions have been obtained from sources believed to be reliable but no representation is made to their accuracy.