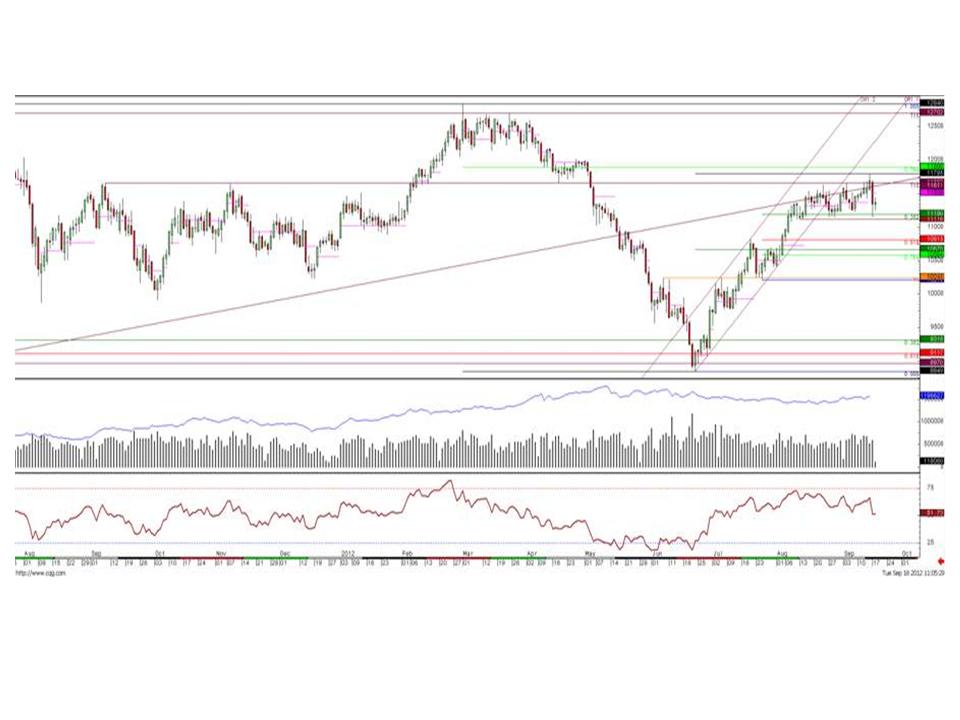
I thought I’d give you my take on yesterdays action. Below is a continuation chart of Brent, it just rolls across to the next monthly contract when volume rolls across.
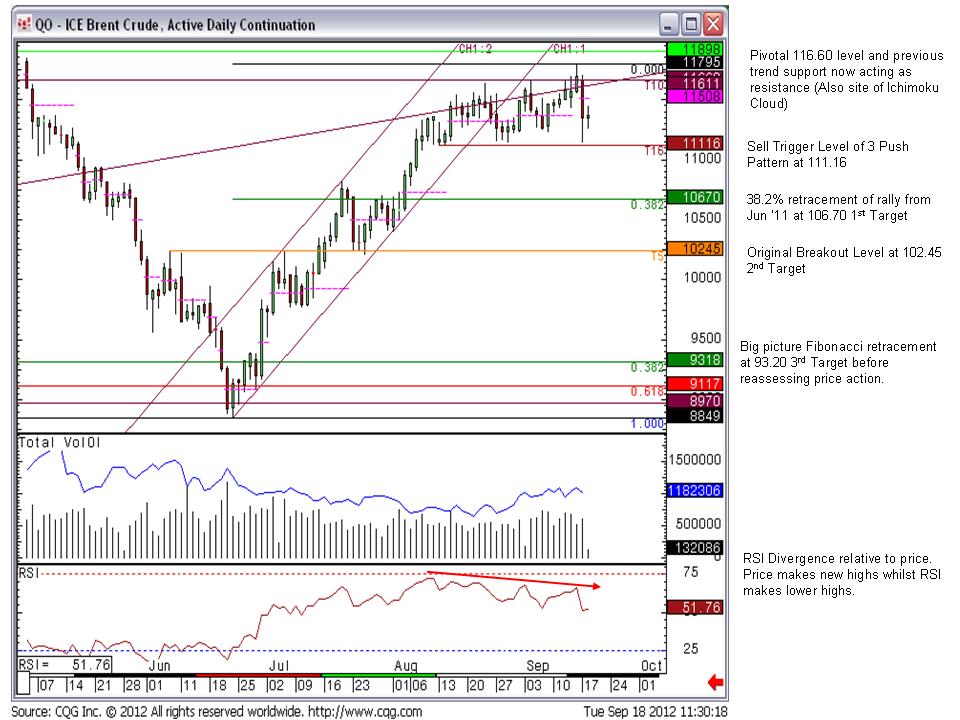
It shows the recent action since the beginning of August has been consolidating below a significantly pivotal level. 116.60 was the Sep ’11 high, Nov ’11 high, Apr ’12 low and the high failure in late Aug ’12 and early Sep ’12. In addition there’s an up trend line from the Dec ’08 low that broke back in May ’12. Previous support now acts as resistance and this line stands at 116.11 today and increases by 8cents a day.
In the lower sub window the Relative Strength Index shows a ‘Divergence’ relative to price where price has been making new highs but the RSI momentum indicator has been making lower highs. This is often a precursor to a corrective move, although not enough of a signal on it’s own to switch tack.

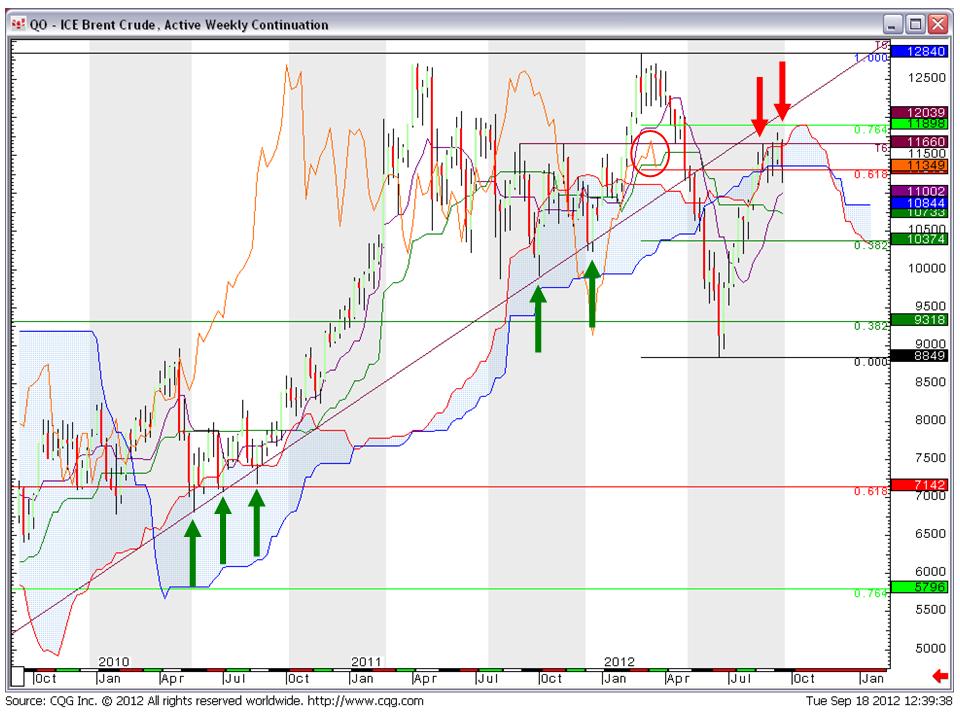
Below is a weekly Ichimoku chart, a Japanese technique designed to follow trends and one that longer term trend followers often reference. The blue shaded area is known as the Ichimoku Cloud and whilst price is above this area it provides support, but if price is below this area it provides resistance. As you can see, back in 2010 the Ichimoku cloud provides support on several occasions before the strong leg higher. Then again in late 2011 the Ichimoku Cloud provided the springboard to a new high for the move at 128.40. 2012 has not seen the same price action, and the sharp sell off broke the Ichimoku cloud convincingly. Recent price action has been struggling at the underside of the Cloud which now acts as resistance between 113.57 and 116.20. As yet, the Lagging Line (bold red line which is the current price plotted 26 time periods in the past) is yet to confirm the break lower as the Lagging Line must close below the Cloud to confirm the move.
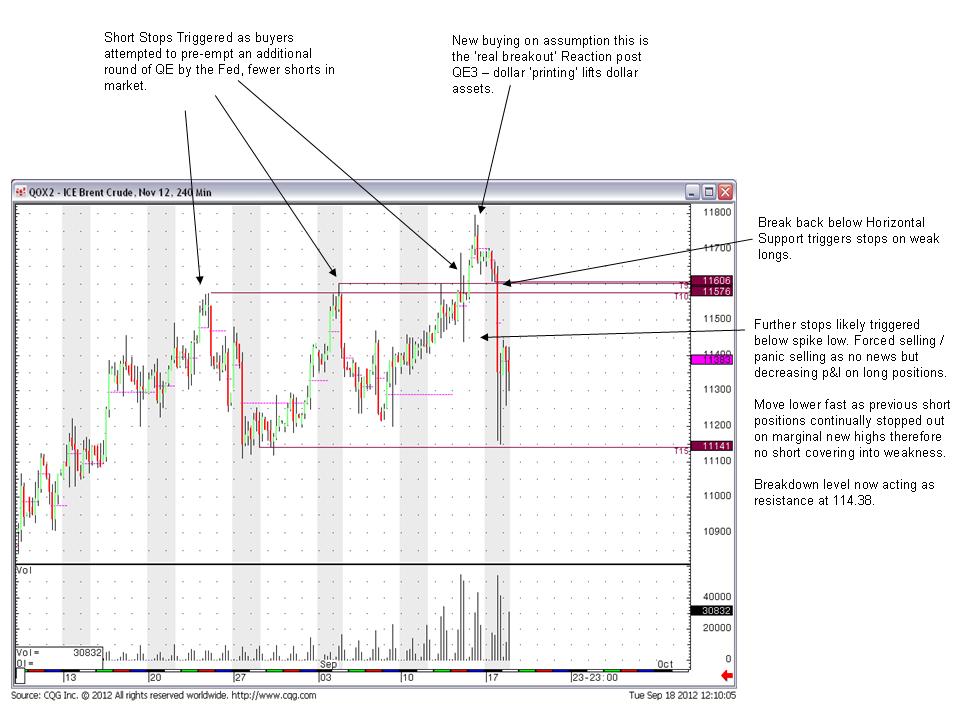
The image below is a look at the 240 minute chart of the November contract. Many market participants have been attempting to pre-empt a rally in Brent ahead of the Fed embarking on QE3. As price printed new highs on the expectation that another round of QE would lift dollar assets and thus oil, ‘Short’ positions were stopped out. This is one of the reasons for the fast move lower yesterday as there were few shorts to cover into weakness and therefore illiquidity exacerbated the move.

The image below shows the short term trading opportunity in the event of a sustained break below 111.16 with 3 targets provided.

In summary, this could be the start of something more significant. If Fridays 117.95 high is not surmounted and proves to be a ‘Lower High’ compared to the Feb 128.40 print, and a breach below the 111.16 trigger level is sustained then big picture trend followers will start to take note and begin to reassess their long term bullish positions.
So that’s my take. Sorry Clive! But that’s what makes a market, even within the same firm!
Cheers,
Liam.

