According to the Ichimoku “Cloud” charts we shouldn’t rule this idea out, but there are some hurdles along the way. Let’s start by looking at some old charts…
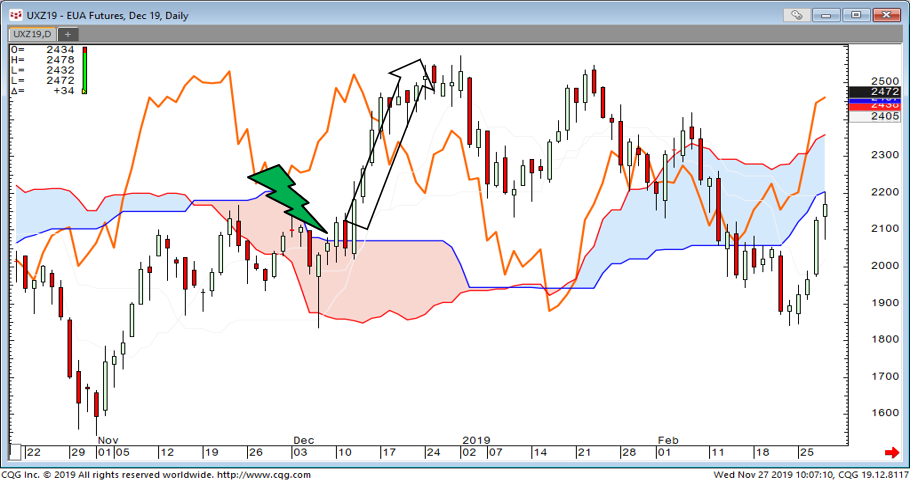
This is the daily “Cloud” chart going back a year ago to Decmeber 2018. It shows that once we got above the top of the Cloud the market saw a sharp spike higher…
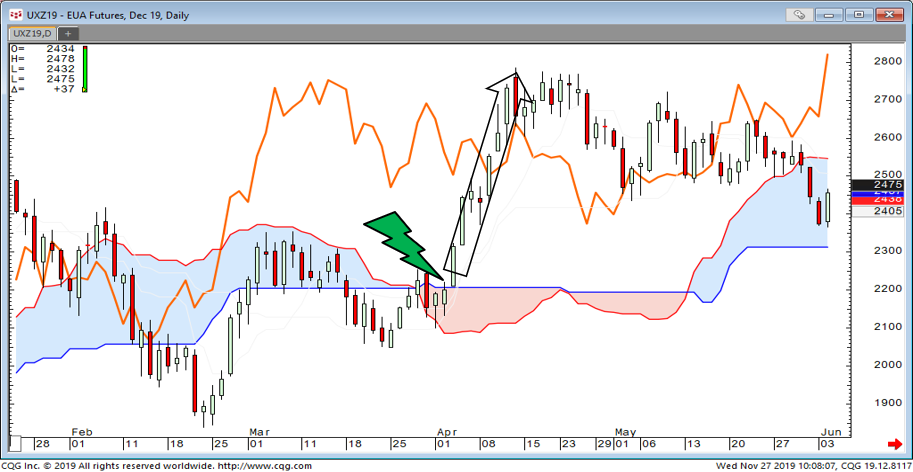
Fast forward to April (2019) and take a look at this one: It shows (deliberate “Groundhog Day” moment coming up!) that once we got above the top of the Cloud the market had a sharp spike higher…
So where are we at now?
As per the chart below, right now the Ichimoku Cloud chart (which has done a good job of defining trend of late, as you can see) is setting up for similar…
But we haven’t got the buy signal yet. IF we see a move/close above 25.15 today, or 24.76 tomorrow/next week we will get the buy signal.
Based on recent history this could/should prompt a swift move higher, a move that could potentially see us retesting the years highs in the coming weeks…
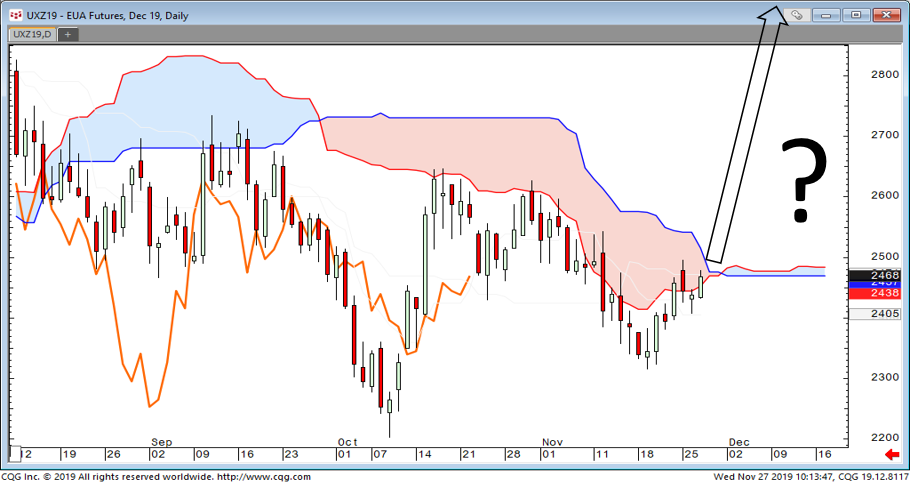
Interesting times…
While I’ve got you here’s a recording I did yesterday for Core Finance, looking at Oil, Gold and Palladium.
Palladium? That’s a new one for Clive, I hear you say (maybe!). Well here’s the thing; we are currently trialling reports for a couple of clients on LME Copper and Nickel, plus Platinum and Palladium.
If you want to take a look at our Energy Report (We cover Brent Crude, WTI, UK NBP Gas, Dutch TTF Gas, US “Henry Hub” Gas, German Power and Coal as well as EUA Carbon Emissions), or our new Metals reports please let us know.
Happy Thanksgiving. This one always gives me a chuckle!