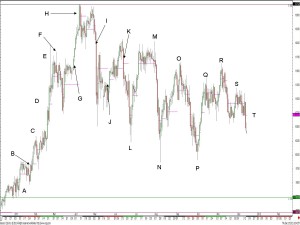
As per our previous post, where we looked at how we’d done over the year in the Bund, here is a similar excercise for Brent Crude:
Brent has been through a volatile period this year and proved difficult for many investors and fund managers to trade successfully. At FuturesTechs we’ve called things pretty well, capitalising on the move up at the start of the year as the Libyan situation escalated, and subsequently calling the move down. Sideways trade since has proved a challenge, but our trend following mantra and reliance on Candlestick patterns as well traditional reversal signals has ensured a vast percentage of the moves have been captured. The chart and captions below review our commentary and thoughts at some of the major turning points throughout the year.
A: Maintained a Bullish SkewBar throughout the start of the year until a neutral stance during a period of consolidation late January.
B: Highlighted the upside breakout as Bullish and called for a move to 104.98.
C: Maintained a Bullish stance during this pullback as a ‘Buy the Dip’ scenario
D: ‘‘Only a big reversal pattern on the daily chart would see me thinking of anything other than bullish thoughts’’ 24.02.2011
E: ‘Shooting Star no confirmation’ – Still Bullish.
F: ‘‘Bearish Engulfing Pattern. For the first time in a while I might just disagree with an outright bull trend following approach.’’
G: ‘‘Are we breaking this consolidation phase to the upside? YES WE ARE!’’
H: ‘‘Don’t buy Brent Crude today’’ Rule of 9.
I: ‘A drop through 119.03 will give us a Double Top sell signal’ 05.05.2011.
J: ‘We would expect 113.50 to continue to hold and for 115.48-62 to give way some time soon to give the bulls encouragement to head to higher levels. ‘
K: ‘’Our Bull Skew got smashed to pieces yesterday. All change.’’
L: ‘‘The Hammer candle indicates the potential for a change of trend so about the previous days Marabuzo line at 107.13 we’ll back the bulls expecting a move to 110.90-111.73.’’
M: ‘’The failure to sustain new highs for the move followed by a significant sell off suggests the bears have the upper hand. A sustained break below 114.66-78 see’s our Skew firmly back the bears. ‘’ 02.08.2011
N: ‘…a Hammer candle indicating the rejection of the new low. This is a potential change of trend signal and on a move through Marabuzo and Fib resistance at 106.14 and 107.01 respectively our Skew backs the bulls for a move up to 110.58 and 112.13.’
O: Our SkewBar struggled whilst Brent chopped around, then we said ‘This pullback has left a potential Right Shoulder of a Head and Shoulders Top formation on a shorter timeframe chart’ 19.09.2011.
‘Our Skew is in neutral territory requiring the bears to break 108.07 before backing them.’ 20.09.2011
P: ‘’Our chart has taken a step back today and put the recent price action within the confines of a broad down trend channel, which we have also labelled a-b-c. This is an Elliott Wave annotation which we’ve added as it’s possible that this recent move lower is the bottom of a counter trend Wave 4. If this is the case, much higher prices are on the horizon.’’ 06.09.2011
Q: ‘’Friday resulted in the 9th Green candle in a row. The ‘Rule of 9’ suggests that this rally will not post more than 9 green candles. So today we expect to post a red candle’’
R: ‘Buying dips was our favoured outlook, but given yesterdays Engulfing candle and a 3 day Evening Star formation our Skew is going to tighten to the broken trend resistance at 111.45. below here our Skew turns bearish acknowledging the reversal candles.’’
S: ‘A trend line across the recent lows provides the Neckline of the potential Head and Shoulders Top and provides support at 105.93 today. Our Skew is in bearish territory below 113.53 down trend resistance.’
T: ‘’This morning the Neckline of the Head and Shoulders is being retested and presents a selling opportunity at 105.77. The 61.8% retracement at 102.45 is the next target for the bears. The Head and Shoulders target is 95.42’’

