
The EUA Carbon market has been in an interesting spot of. Market participants seem to be waiting for the EU ETS Review Package that is set to be published tomorrow on July 17th, before making any significant moves. The market has been trading on pure technicals (more than usual), which is notable for a contract that historically respects technical analysis particularly well.
In light of this move tomorrow, we have put together a Carbon Market Outlook which goes through both possibilities of a Bullish and Bearish reaction to the review. There are plenty of targets to look for on both sides of the current range we find ourselves in.
EUA Carbon Emissions
BEARISH CASE:
A break of 78.31 triggers a Double/Triple Top sell signal with a “measured move” target of 74.35. We have a key Fibonacci support in front of that target at 74.95. If saw selling that failed to hold this strong area of support with a 74 handle the next downside target zone would be 70.00–43.
BULLISH CASE:
A move above 81.94-82.28 signals an end to the recent consolidation and says we can head to 84.84, 87.07, 91.76 and 93.61-93.80. There really isn’t much to reference above 82.28 until we get to 84.84 so there’s scope for a swift move if upside prevails.
UKA Carbon Emissions
BEARISH CASE:
A break below 54.41 would give us a Double Top sell signal. Like EUAs we can apply a “measured move” target to this. It is 47.83. Before we even worry 54.41 we have that uptrend line on our chart to reference. This is at 56.29 tomorrow. Fibonacci says 50.71 is a downside level to watch as well.
BULLISH CASE:
Clearly 60.83-61.00 is strong resistance. A move above here says we can head to 66.20-60 then 71.51 then 75.45, the latter being the year’s high set back in January.
In terms of our Technical Analysis for EUA Carbon, we identified 81.94 as a important resistance level which is a 61.8% Fibonacci retracement of the sell-off from mid-January to mid-March this year. It has served as a highly reliable ceiling since late May, beautifully capping upside momentum and even providing the exact high of the day on 24th June.
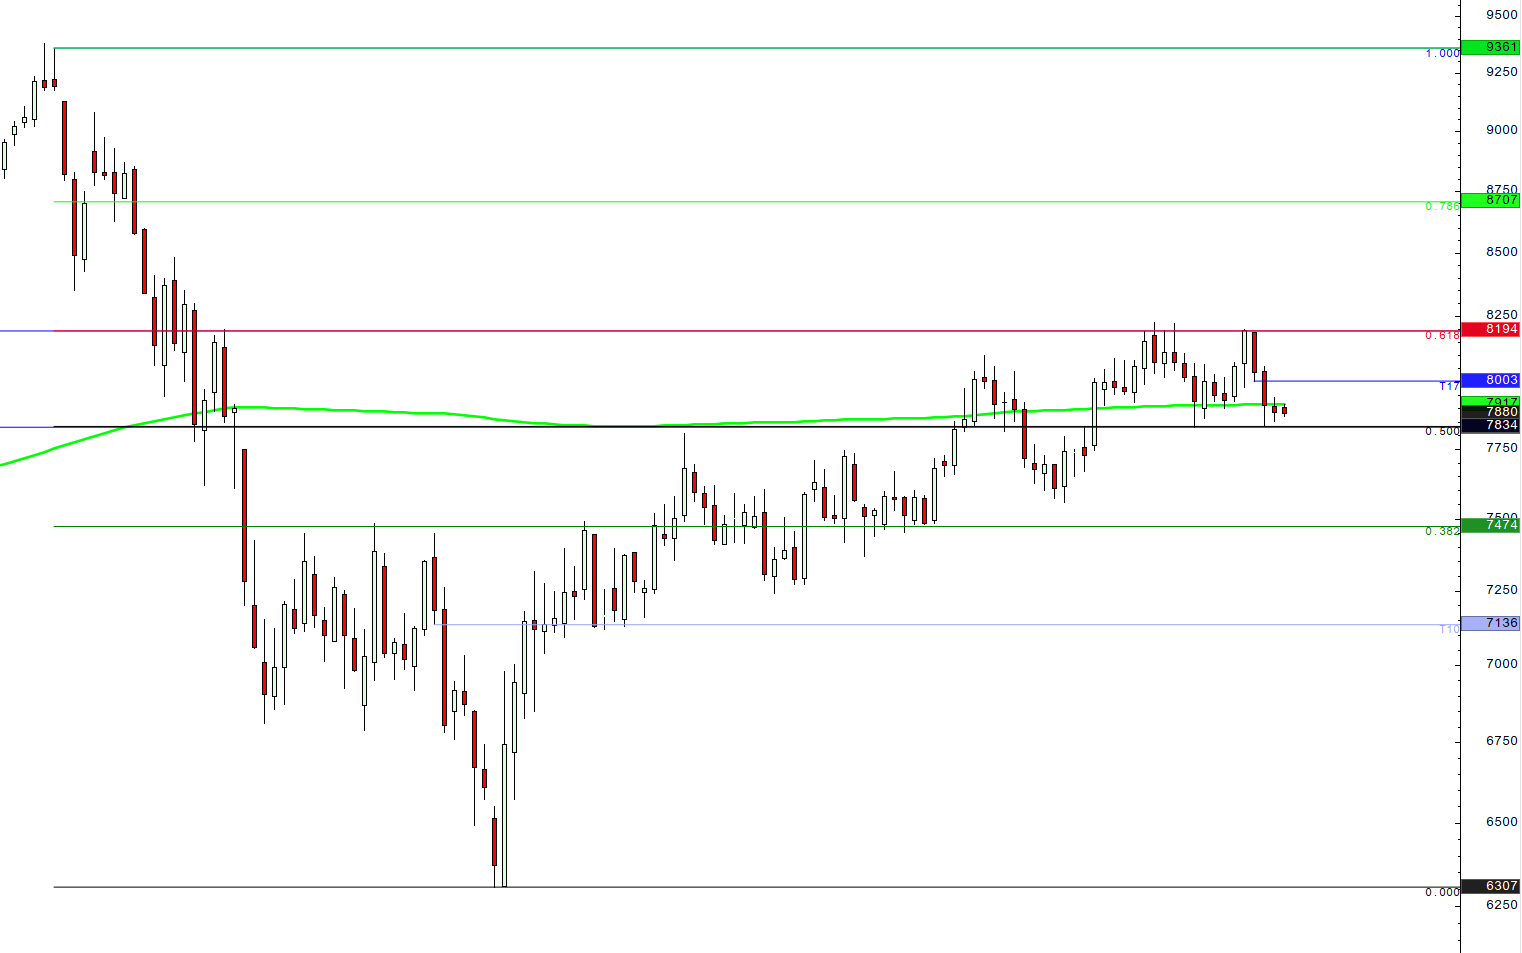
We are currently seeing a potential ‘Double/Triple Top’ that would signal a sell-off if we break below 78.31 – target of 74.40, which lines up nicely with the next Fibonacci level under the 50% retracement at 74.97 – lovely bit of symmetry!
While many currently rely on the 200-day SMA, and the psychological ‘80.00’ handle, it is important to get a full technical view of the market. The daily reports give traders an advantage every morning, providing a comprehensive run-down on what you might expect from price action. In our opinion, a highly valuable tool to have in your back pocket.
It remains to be seen how the market reacts to the upcoming legislation, but our analysis will continue to provide actionable and objective levels (like 81.94!) and commentary that cuts out the noise. If you believe you would benefit from this, please contact us and start a Free Trial today.

Clive Lambert FSTA – FuturesTechs
25 years of institutional expertise in the UK and European Energy Markets and 10-time Technical Analysis award winner. Clive provides industry-standard technical outlook, utilising Market Profile and Candlesticks Analysis for over 100 global trading desks.
Disclaimer:
This communication has been prepared solely for information and data purposes and is not intended as an Invitation or Inducement with respect to the purchase or sale of any financial instrument. This communication should not be regarded as a substitute for the exercise by the recipient of its own judgement. Any reliance placed on the communication is at the reader’s risk. Information and opinions have been obtained from sources believed to be reliable but no representation is made to their accuracy.