
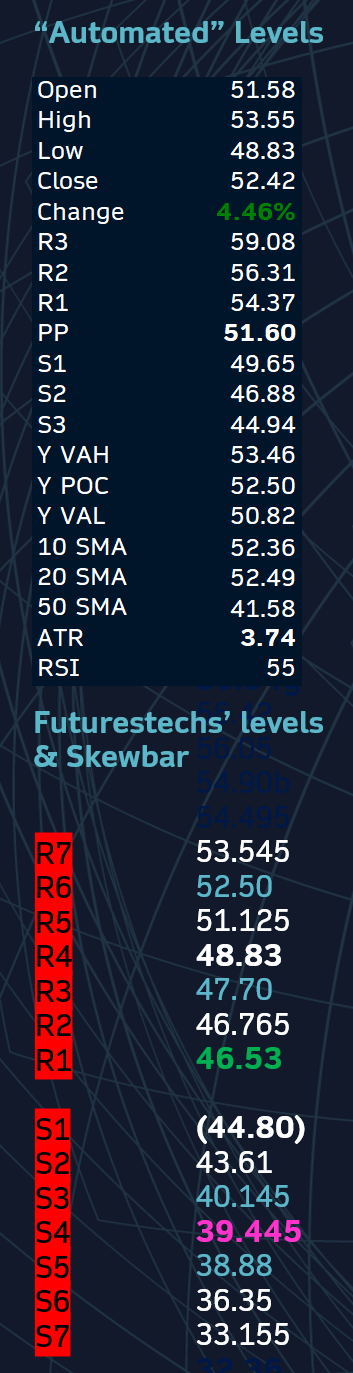
This is what we sent out to clients this morning pre-open. The market opened at 45.00 and has since recovered to 45.95 where sellers returned shy of that 46.53 level.
Candlestick Chart & Technical Analysis
•Short term Trend: Bearish
•Medium term Trend: Neutral
•Yesterday’s candle:
48.83 was yesterday’s low. We are called to open lower but how much lower? Below 46.53 I’m sure, but maybe even lower…
The gap up at the start of all this is down at 32.36-36.35.
•Fibonacci says: Stuck between 46.53 and 56.94 for now. – Should open below 46.53 today.
•Moving Averages/Indicators/other: MACDMoving Average Convergence Divergence - a technical analysis... gives a sell signal. Signs of bearish divergence on the RSIRelative Strength Index - The speed and change of price move... More. Price agreeing.
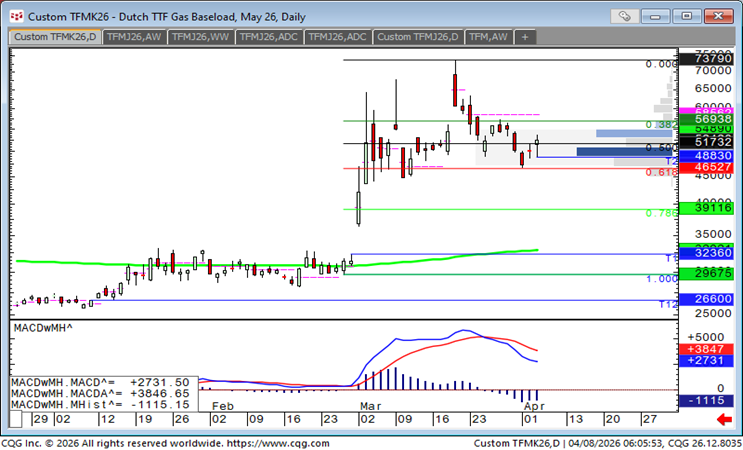
•Summary/Thoughts: Fibonacci “support” at 46.53 is likely to be above us from the off today.
•Favoured trade(s) for today: Scope for 2-way trade. Bear side preferred.
•Bigger Picture thoughts and targets: 46.53 is today’s key level? Or will it be 32.36?!
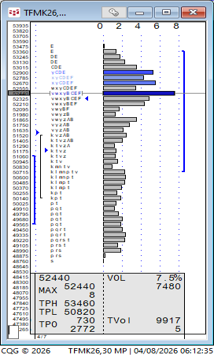
Market Profile
•Profile setup/levels: 52.50 is yesterday’s VPOCVolume Point of Control – The price where the most volume ... More.
•20-day CHVNComposite High Volume Node – “Composite” profiles; tho... More: 49.00
•Naked VPOCsVolume Point of Control – The price where the most volume ... More below: 42.30, 32.00, 30.75
•Naked VPOCsVolume Point of Control – The price where the most volume ... More above: 54.90, 64.50.
•SPVsSingle Print Vacuum – Similar to an LVN/CLVN. A price or p... More in play below: 40.145, 38.88.
•SPVsSingle Print Vacuum – Similar to an LVN/CLVN. A price or p... More in play above: 60.57.
Support & Resistance Levels
Key
Purple = Marabuzo lines
Green = Fibonacci level
Blue = Market Profile level
Orange = Trendlines/Chart Pattern levels

Clive Lambert FSTA – FuturesTechs
25 years of institutional expertise in the UK and European Energy Markets and 10-time Technical Analysis award winner. Clive provides industry-standard technical outlook, utilising Market Profile and Candlesticks Analysis for over 100 global trading desks.
Disclaimer:
This communication has been prepared solely for information and data purposes and is not intended as an Invitation or Inducement with respect to the purchase or sale of any financial instrument. This communication should not be regarded as a substitute for the exercise by the recipient of its own judgement. Any reliance placed on the communication is at the reader’s risk. Information and opinions have been obtained from sources believed to be reliable but no representation is made to their accuracy.