
After a long weekend in the UK, today’s blog post runs through our ‘Chart Wrap’ that we do daily, here at Futurestechs. In today’s edition, we look at the Gap support and resistance levels after some interesting price discovery since Friday’s close.
We cover a range of asset classes in different market sectors, providing concise and high-conviction levels to look for across the day.
If you would like to receive the Chart Wrap or start a Free Trial. Please get in touch and we will set that up.
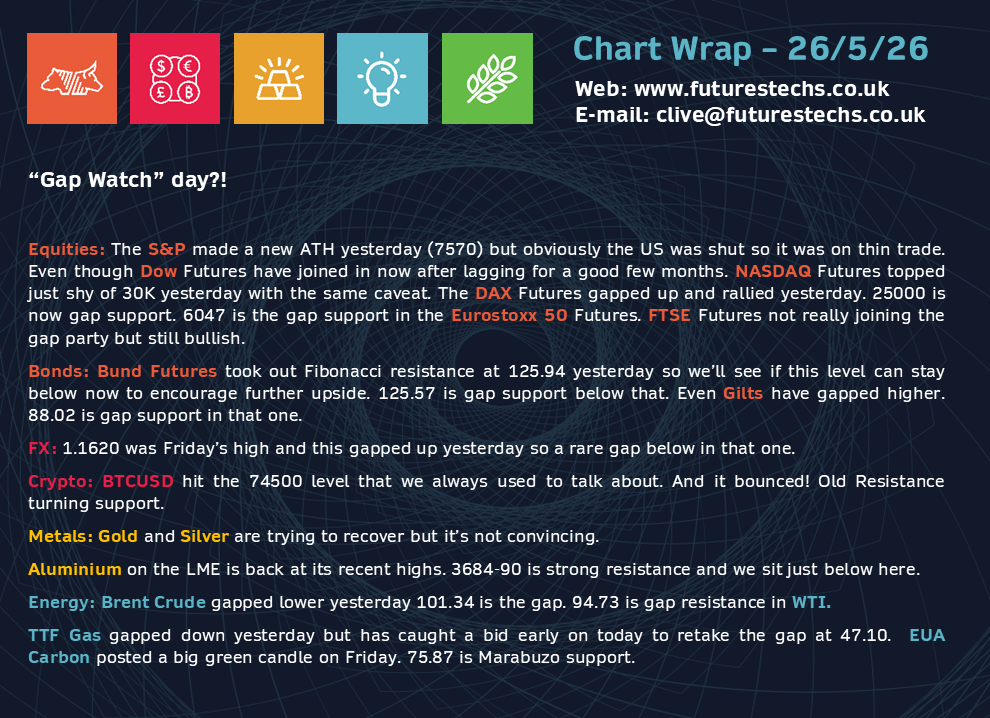
The S&P made a new ATH yesterday (7570) but obviously the US was shut so it was on thin trade. Even though Dow Futures have joined in now after lagging for a good few months. NASDAQ Futures topped just shy of 30K yesterday with the same caveat. The DAX Futures gapped up and rallied yesterday. 25000 is now gap support. 6047 is the gap support in the Eurostoxx 50 Futures. FTSE Futures not really joining the gap party but still bullish.
Bund Futures took out Fibonacci resistance at 125.94 yesterday so we’ll see if this level can stay below now to encourage further upside. 125.57 is gap support below that. Even Gilts have gapped higher. 88.02 is gap support in that one.
1.1620 was Friday’s EURUSD high and this gapped up yesterday so a rare gap below in that one.
BTCUSD hit the 74500 level that we always used to talk about. And it bounced! Old Resistance turning support.
Gold and Silver are trying to recover but it’s not convincing.
Aluminium on the LME is back at its recent highs. 3684-90 is strong resistance and we sit just below here.
Brent Crude gapped lower yesterday 101.34 is the gap. 94.73 is gap resistance in WTI.
TTF Gas gapped down yesterday but has caught a bid early on today to retake the gap at 47.10. EUA Carbon posted a big green candle on Friday. 75.87 is Marabuzo support.

Clive Lambert FSTA – FuturesTechs
25 years of institutional expertise in the UK and European Energy Markets and 10-time Technical Analysis award winner. Clive provides industry-standard technical outlook, utilising Market Profile and Candlesticks Analysis for over 100 global trading desks.
Disclaimer:
This communication has been prepared solely for information and data purposes and is not intended as an Invitation or Inducement with respect to the purchase or sale of any financial instrument. This communication should not be regarded as a substitute for the exercise by the recipient of its own judgement. Any reliance placed on the communication is at the reader’s risk. Information and opinions have been obtained from sources believed to be reliable but no representation is made to their accuracy.