
Candlestick Chart & Technical Analysis
•Short term Trend: Neutral – Bearish
•Medium term Trend: Bullish
•Yesterday’s candle: May is now front month. The last three sessions have been tight range affairs (relatively!) with gap support at 53.495 doing a job as support but 56.94 and 58.56 capping upside. Chance we could gap down today basis overnight moves?
•Fibonacci says: 56.94 is a reference in play right now, then 46.53 on further weakness.
•Moving Averages/Indicators/other: MACDMoving Average Convergence Divergence - a technical analysis... gives a sell signal. Signs of bearish divergence on the RSIRelative Strength Index - The speed and change of price move... More.
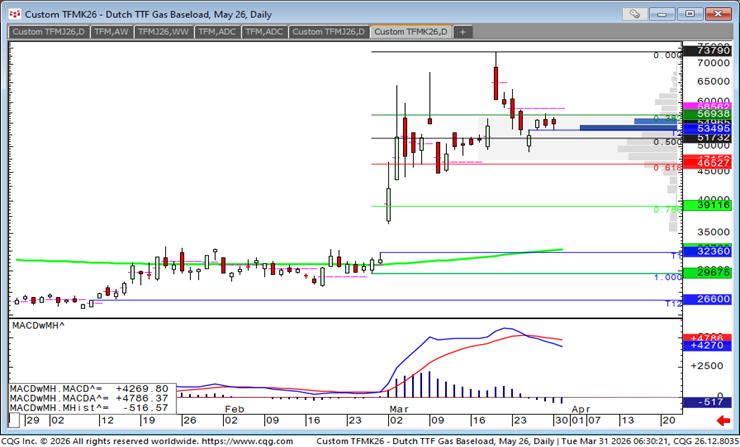
•Summary/Thoughts: Bearish for choice as we start a new week.
•Favoured trade(s) for today: Short side favoured for now.
•Bigger Picture thoughts and targets: 77.14 the next upside target, then 110.68 and 144.44.
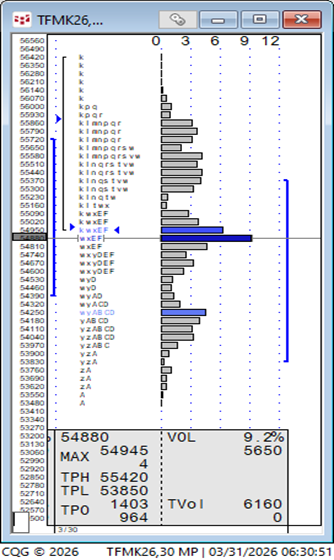
Market Profile
•Profile setup/levels: 54.90 is yesterday’s VPOCVolume Point of Control – The price where the most volume ... More. I’ve put this at S1.
•20-day CHVNComposite High Volume Node – “Composite” profiles; tho... More: 55.00 – New data.
•Naked VPOCsVolume Point of Control – The price where the most volume ... More below: 50.00, 39.00, 31.75, 29.30
•Naked VPOCsVolume Point of Control – The price where the most volume ... More above: 64.50.
•SPVsSingle Print Vacuum – Similar to an LVN/CLVN. A price or p... More in play below: 51.37, 40.145, 38.88.
•SPVsSingle Print Vacuum – Similar to an LVN/CLVN. A price or p... More in play above: 60.57.
Support & Resistance Levels
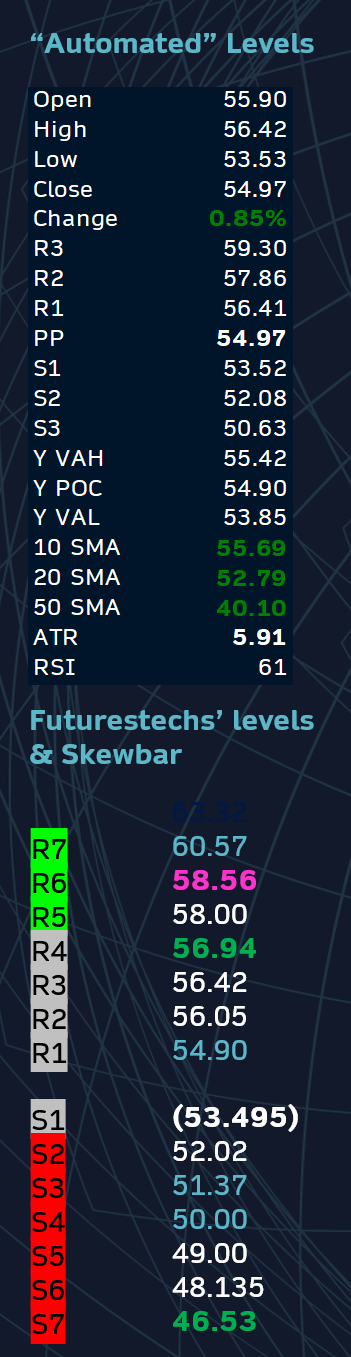
Key
Purple = Marabuzo lines
Green = Fibonacci level
Blue = Market Profile level
Orange = Trendlines/Chart Pattern levels

Clive Lambert FSTA – FuturesTechs
25 years of institutional expertise in the UK and European Energy Markets and 10-time Technical Analysis award winner. Clive provides industry-standard technical outlook, utilising Market Profile and Candlesticks Analysis for over 100 global trading desks.
Disclaimer:
This communication has been prepared solely for information and data purposes and is not intended as an Invitation or Inducement with respect to the purchase or sale of any financial instrument. This communication should not be regarded as a substitute for the exercise by the recipient of its own judgement. Any reliance placed on the communication is at the reader’s risk. Information and opinions have been obtained from sources believed to be reliable but no representation is made to their accuracy.